This site uses cookies to improve your experience. To help us insure we adhere to various privacy regulations, please select your country/region of residence. If you do not select a country, we will assume you are from the United States. Select your Cookie Settings or view our Privacy Policy and Terms of Use.
Cookie Settings
Cookies and similar technologies are used on this website for proper function of the website, for tracking performance analytics and for marketing purposes. We and some of our third-party providers may use cookie data for various purposes. Please review the cookie settings below and choose your preference.
Used for the proper function of the website
Used for monitoring website traffic and interactions
Cookie Settings
Cookies and similar technologies are used on this website for proper function of the website, for tracking performance analytics and for marketing purposes. We and some of our third-party providers may use cookie data for various purposes. Please review the cookie settings below and choose your preference.
Strictly Necessary: Used for the proper function of the website
Performance/Analytics: Used for monitoring website traffic and interactions
Google Analytics, a tool widely used by marketers, provides invaluable insights into website performance, user behavior and critical analytic data that helps marketers understand the customer journey and improve marketing ROI. Your data will now automatically refresh within your Snowflake account based on your preferred frequency.
Annual Report: The State of Apache Airflow® 2025 DataOps on Apache Airflow® is powering the future of business – this report reviews responses from 5,000+ data practitioners to reveal how and what’s coming next. Data Council 2025 is set for April 22-24 in Oakland, CA.
While watching a loved one experience a health issue, it became glaringly obvious there was a disconnect in healthcare data and the way providers are able to access and act on it. Every time we had a visit to a primary care physician, an ER trip or a referral to a specialist, data was collected.
However, that data must be ingested into our Snowflake instance before it can be used to measure engagement or help SDR managers coach their reps — and the existing ingestion process had some pain points when it came to data transformation and API calls. Each of these sources may store data differently.
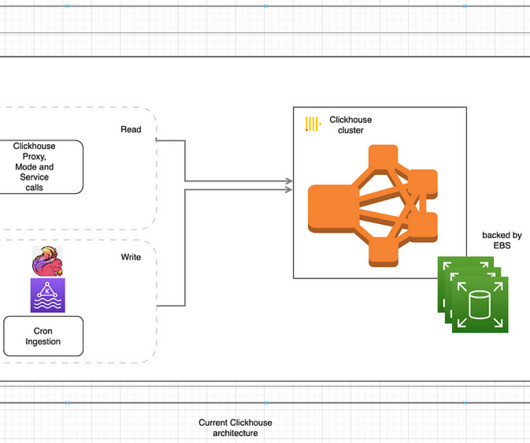
Streaming data feeds many real-time analytics applications, from logistics tracking to real-time personalization. Event streams, such as clickstreams, IoT data and other time series data, are common sources of data into these apps. ClickHouse has several storage engines that can pre-aggregatedata.
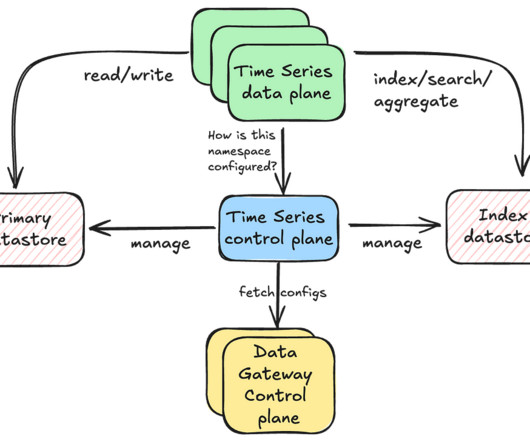
Rajiv Shringi Vinay Chella Kaidan Fullerton Oleksii Tkachuk Joey Lynch Introduction As Netflix continues to expand and diversify into various sectors like Video on Demand and Gaming , the ability to ingest and store vast amounts of temporal data — often reaching petabytes — with millisecond access latency has become increasingly vital.
They define a process and methodology that will show how you will keep your network secure and safe from attempts at unauthorized access. For instance, HTTP: Moved data over the web. SSH: Safe remote access and management to servers. SSL/TLS: It encrypts network data. HTTPS: HTTP encrypted with SSL/TLS.
Incorporate data from novel sources — social media feeds, alternative credit histories (utility and rental payments), geo-spatial systems, and IoT streams — into liquidity risk models. Use cases include: Enable transparent access to financial data. Possible applications include: Improved customer risk profiling.
Application programming interfaces (APIs) are used to modify the retrieved data set for integration and to support users in keeping track of all the jobs. Users can schedule ETL jobs, and they can also choose the events that will trigger them. Create schedules or events that will act as job triggers.
Our initial use for Druid was for near real-time geospatial querying and high performance on high-cardinality data sets. It also allowed us to optimize for handling time-series data and eventdata at scale. Pre-aggregatingdata at ingestion time helped optimize our query performance and reduce our storage costs.
The reality is that data warehousing contains a large variety of queries both small and large; there are many circumstances where Impala queries small amounts of data; when end users are iterating on a use case, filtering down to a specific time window, working with dimension tables, or pre-aggregateddata.
The data scientist “just” deploys its trained model, and production engineers can access it. While all these solutions help data scientists, data engineers and production engineers to work better together, there are underlying challenges within the hidden debts: Data collection (i.e.,
Gatekeeper accomplishes its prescribed task by aggregatingdata from multiple upstream systems, applying some business logic, then producing an output detailing the status of each video in each country. Near : the cache exists in RAM on any instance which requires access to the dataset.
Data producers deliver data products from a single source or set of sources, such as data from a CRM application. Those data products could be used by themselves or aggregated into an aggregatedata product, like the customer 360 described above. Product thinking works from the outside in.
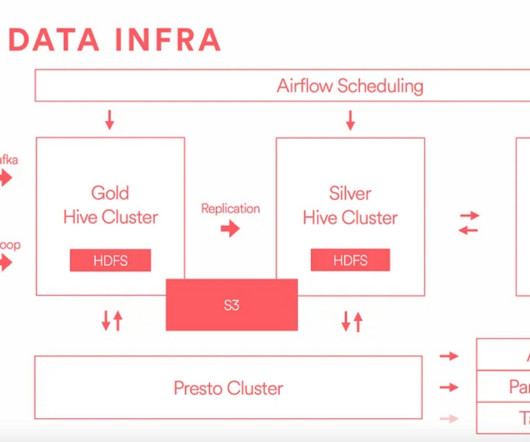
Our RU framework ensures that our big data infrastructure, which consists of over 55,000 hosts and 20 clusters holding exabytes of data, is deployed and updated smoothly by minimizing downtime and avoiding performance degradation. Accessibility of all namenodes. No concurrent upgrades are happening within the cluster.
Additionally, having a centralized repository of metrics facilitates easy access to metrics, empowering all members of an organization to analyze experiment results. Data scientists are the primary metric creators and are already familiar with SQL, so it made sense to use SQL as the language to define metrics instead of building our own DSL.
It’s simply too expensive to store all the raw data and simply too slow to run batch processes to pre-aggregate it. One common example is a mobile app, where every activity is recorded as an event, resulting in millions of events per day streaming in.
This scenario involves three main characters — publishers, subscribers, and a message or event broker. A publisher (say, telematics or Internet of Medical Things system) produces data units, also called events or messages , and directs them not to consumers but to a middleware platform — a broker. Kafka cluster and brokers.
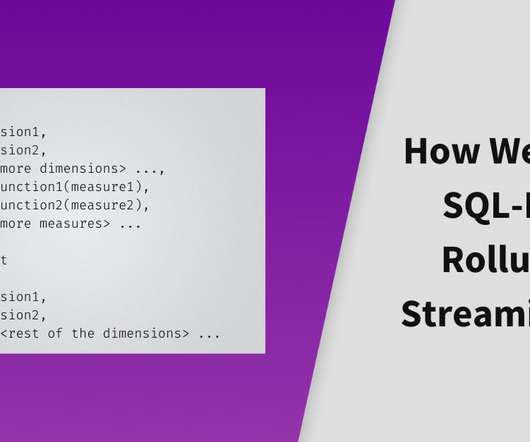
It eliminates the cost and complexity around data preparation, performance tuning and operations, helping to accelerate the movement from batch to real-time analytics. The latest Rockset release, SQL-based rollups, has made real-time analytics on streaming data a lot more affordable and accessible.
Experiment exposures are one of our highest volume events. On a typical day, our platform produces between 80 billion and 110 billion exposure events. We stream these events to Kafka and then store them in Snowflake. Users can query this data to troubleshoot their experiments. Below are sample charts from our dashboards.
Datadog aggregatesdata based on the specific “operations” they are associated with, such as acting as a server, client, RabbitMQ interaction, database query, or various methods. The capability to aggregatedata in one place, combined with a wide range of integrations, simplifies data collection and access.
Then, the data is analyzed and transformed into a format that’s digestible for target users, enabling them to draw conclusions or immediately garner insights once the data is entered into a company’s system. Users can access this data on a dashboard, report, or another medium. Cloud Solutions Architect at Striim.
In addition, Rockset provides fast dataaccess through the use of more performant hot storage, while cloud storage is used for durability. Then, I used the integration to create a collection, twitter_kinesis_30day , that syncs Twitter data from the Kinesis stream.
That’s why some MDS tools are commercial distributions designed to be low-code or even no-code, making them accessible to data practitioners with minimal technical expertise. This means that companies don’t necessarily need a large data engineering team. Data democratization. Event streams.
The terms “ Data Warehouse ” and “ Data Lake ” may have confused you, and you have some questions. In the event that they are not the same, what are the difference s? The DW and databases support multi-user access. In order to access the data, both the DW and the database require queries.
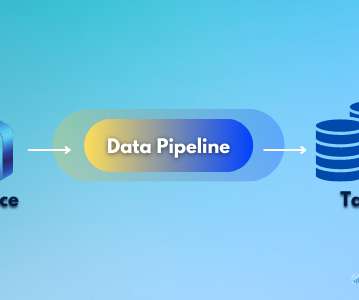
Data pipelines are significant to businesses because they: Consolidate Data: Data pipelines are responsible for integrating and unifying data from diverse sources and formats, making it consistent and usable for analytics and business intelligence.
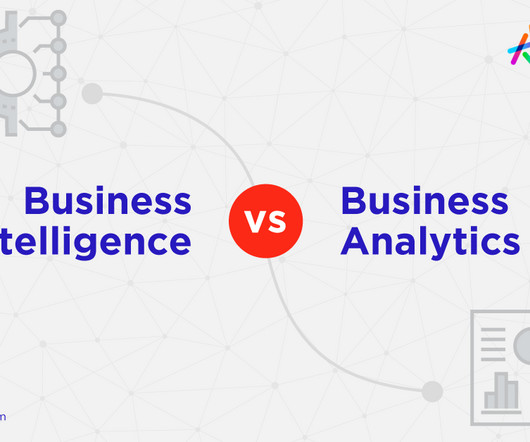
New Analytics Strategy vs. Existing Analytics Strategy Business Intelligence is concerned with aggregateddata collected from various sources (like databases) and analyzed for insights about a business' performance. Ease of Operations BI systems make it easy for businesses to store, access and analyze data.
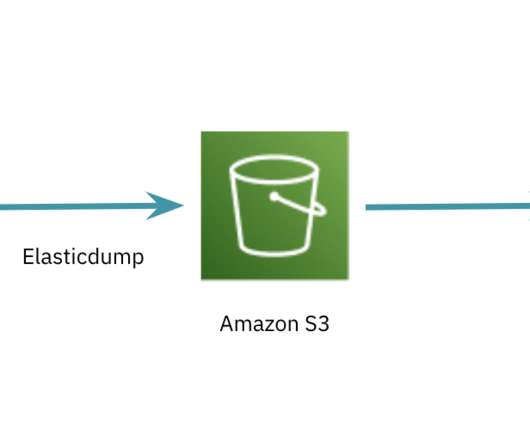
Step 1: Data Acquisition Elasticsearch is rarely the system of record which means the data in it comes from somewhere else for real-time analytics. Rockset has built-in connectors to stream real-time data for testing and simulating production workloads including Apache Kafka , Kinesis and Event Hubs.
The Data Lake acts as the central repository for aggregatingdata from diverse sources in its raw format. Typically, it is advisable to retain the data in its original, unaltered format when transferring it from any source to the data lake layer.
The aim of selecting an ETL tool is to ensure that data is moving into Hadoop at a frequency that can meet the analytic requirements. Sqoop vs Flume-Comparison of the two Best Data Ingestion Tools Get FREE Access to Data Analytics Example Codes for Data Cleaning, Data Munging, and Data Visualization What is Sqoop in Hadoop?
AggregateData: If you don't need granularity, consider aggregatingdata before loading it into Power BI to reduce the volume of data. Sort and Filter Early: Apply sorting and filtering in your queries as early as possible to reduce the amount of data transferred and processed.
Minerva takes fact and dimension tables as inputs, performs data denormalization, and serves the aggregateddata to downstream applications. Flexible Backfills: Minerva version controls data definitions, so major changes to the datasets are automatically tracked and backfilled.
After thoroughly examining each circumstance, they will share any new knowledge obtained about current cyber threats or vulnerabilities inside their network so that future events can be avoided, if possible, by immediate fixes. Essential compliance consists of access to patch levels, threat information, identity, and dataaccess control.
PySpark allows you to process data from Hadoop HDFS , AWS S3, and various other file systems. Get FREE Access to Data Analytics Example Codes for Data Cleaning, Data Munging, and Data Visualization The PySpark Architecture The PySpark architecture consists of various parts such as Spark Conf, RDDs, Spark Context, Dataframes , etc.
We’ll explore its advantages, delve into its applications, and highlight why Python is increasingly becoming the first choice for data engineers worldwide. Why Python for Data Engineering? As the field of data engineering evolves, the need for a versatile, performant, and easily accessible language becomes paramount.
This includes integration with common data sources, incident management systems, ticketing systems, CI/CD tools, and more, further streamlining the process of identifying and resolving issues. Security: Observability platforms often include built-in security features to ensure the integrity and confidentiality of your data.
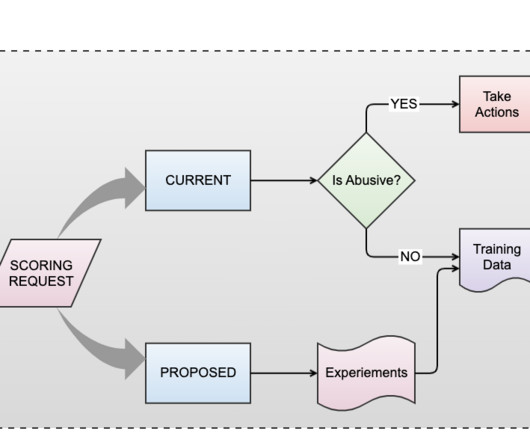
This includes taking measures such as issuing warnings, restricting access, or suspending accounts as necessary. The feedback loop serves as a critical component of a dynamic defense strategy, constantly monitoring and aggregatingdata from abuse reports, member feedback, and reviewer input.
The second step for building etl pipelines is data transformation, which entails converting the raw data into the format required by the end-application. The transformed data is then placed into the destination data warehouse or data lake. It can also be made accessible as an API and distributed to stakeholders.
The big data analytics market is set to reach $103 billion by 2023 , with poor data quality costing the US economy up to $3.1 Fortune 1000 companies can gain more than $65 million additional net income, only by increasing their dataaccessibility by 10%. What is Data Governance? trillion yearly.
Knowledge Graphs, to quote the Alan Turing Institute , “organise data from multiple sources, capture information about entities of interest in a given domain or task (like people, places or events), and forge connections between them.” It was hypothesised that in combination with the Knowledge Graph, the LLM (e.g.
In ELT, raw data is loaded into the destination, and then it receives transformations when it’s needed. Organizations now operate huge amounts of various data stored in multiple systems. ELT makes it easier to manage and access all this information by allowing both raw and cleaned data to be loaded and stored for further analysis.
When any particular project is open-sourced, it makes the source code accessible to anyone. The adaptability and technical superiority of such open-source big data projects make them stand out for community use. It serves as a distributed processing engine for both categories of data streams: unbounded and bounded.
Get FREE Access to Data Analytics Example Codes for Data Cleaning, Data Munging, and Data Visualization What Kafka does? Kafka is extensively being used across industries for general – purpose messaging system where high availability and real time data integration and analytics are of utmost importance.
To be an Azure Data Engineer, you must have a working knowledge of SQL (Structured Query Language), which is used to extract and manipulate data from relational databases. You should be able to create intricate queries that use subqueries, join numerous tables, and aggregatedata.
We organize all of the trending information in your field so you don't have to. Join 37,000+ users and stay up to date on the latest articles your peers are reading.
You know about us, now we want to get to know you!
Let's personalize your content
Let's get even more personalized
We recognize your account from another site in our network, please click 'Send Email' below to continue with verifying your account and setting a password.


Let's personalize your content