This site uses cookies to improve your experience. To help us insure we adhere to various privacy regulations, please select your country/region of residence. If you do not select a country, we will assume you are from the United States. Select your Cookie Settings or view our Privacy Policy and Terms of Use.
Cookie Settings
Cookies and similar technologies are used on this website for proper function of the website, for tracking performance analytics and for marketing purposes. We and some of our third-party providers may use cookie data for various purposes. Please review the cookie settings below and choose your preference.
Used for the proper function of the website
Used for monitoring website traffic and interactions
Cookie Settings
Cookies and similar technologies are used on this website for proper function of the website, for tracking performance analytics and for marketing purposes. We and some of our third-party providers may use cookie data for various purposes. Please review the cookie settings below and choose your preference.
Strictly Necessary: Used for the proper function of the website
Performance/Analytics: Used for monitoring website traffic and interactions
What is Data Transformation? Data transformation is the process of converting rawdata into a usable format to generate insights. It involves cleaning, normalizing, validating, and enriching data, ensuring that it is consistent and ready for analysis.
Bring your raw Google Analytics data to Snowflake with just a few clicks The Snowflake Connector for Google Analytics makes it a breeze to get your Google Analytics data, either aggregateddata or rawdata, into your Snowflake account. Here’s a quick guide to get started: 1.
In this post, I will go over a technique for enabling a cheap data injestion and cheap data consumption for “big data”. Photo by Joshua Sortino on Unsplash Let’s imagine we have rawdata in the granularity of timestamps and we need to calculate the totals per customer.
Data producers deliver data products from a single source or set of sources, such as data from a CRM application. Those data products could be used by themselves or aggregated into an aggregatedata product, like the customer 360 described above. Product thinking works from the outside in.
However, consuming this rawdata presents several pain points: The number of requests varies across models; some receive a large number of requests, while others receive only a few. For some models, aggregatingdata with simple queries is easy, while for others the data is too large to process on a single machine.
Empowering Data-Driven Decisions: Whether you run a small online store or oversee a multinational corporation, the insights hidden in your data are priceless. Airbyte ensures that you don’t miss out on those insights due to tangled data integration processes. Design your integration pipelines with flexibility in mind.
Furthermore, one cannot combine and aggregatedata from publicly available job boards into custom graphs or dashboards. The client needed to build its own internal data pipeline with enough flexibility to meet the business requirements for a job market analysis platform & dashboard.
Furthermore, one cannot combine and aggregatedata from publicly available job boards into custom graphs or dashboards. The client needed to build its own internal data pipeline with enough flexibility to meet the business requirements for a job market analysis platform & dashboard.
Imagine you’re tasked with managing a critical data pipeline in Snowflake that processes and transforms large datasets. This pipeline consists of several sequential tasks: Task A: Loads rawdata into a staging table. Task B: Transforms the data in the staging table.
When looking for a good participant for data cleaning projects, make certain that the data set: is spread across multiple files has a lot of nuances, null values, and cleaning approaches. These websites gather data from various sources without sorting it, making them excellent options for cleaning projects.
The process of merging and summarizing data from various sources in order to generate insightful conclusions is known as dataaggregation. The purpose of dataaggregation is to make it easier to analyze and interpret large amounts of data. Let's look at the use case of dataaggregation below.
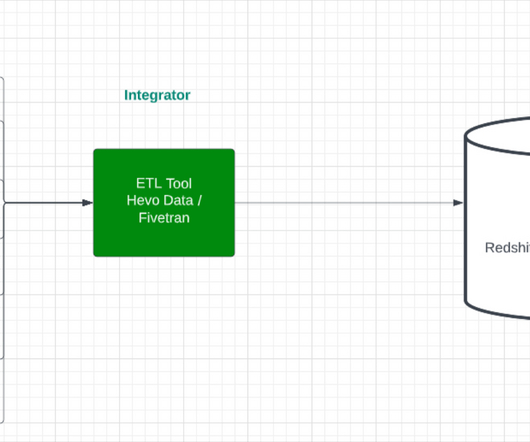
More importantly, we will contextualize ELT in the current scenario, where data is perpetually in motion, and the boundaries of innovation are constantly being redrawn. Extract The initial stage of the ELT process is the extraction of data from various source systems. What Is ELT? So, what exactly is ELT?
If you work at a relatively large company, you've seen this cycle happening many times: Analytics team wants to use unstructured data on their models or analysis. For example, an industrial analytics team wants to use the logs from rawdata.
All data will be indexed in real-time , and Rockset’s distributed SQL engine will leverage the indexes and provide sub-second query response times. But until this release, all these data sources involved indexing the incoming rawdata on a record by record basis. That is sufficient for some use cases.
They are an essential part of the modern data stack for powering: Real-time search applications Social features in the product Recommendation/rewards features in the product Real-time dashboards IoT applications These use cases can have several TBs per day streaming in - they are literally data torrents.
Cleaning Bad data can derail an entire company, and the foundation of bad data is unclean data. Therefore it’s of immense importance that the data that enters a data warehouse needs to be cleaned. Yes, data warehouses can store unstructured data as a blob datatype. They need to be transformed.
Autonomous data warehouse from Oracle. . What is Data Lake? . Essentially, a data lake is a repository of rawdata from disparate sources. A data lake stores current and historical data similar to a data warehouse. As training data increases, deep learning requires scalability.
These steps ensure that our data is always up-to-date and complete. Most of the inferences in our stats engine are performed using the Delta method which operates directly on moment aggregates at the experiment level. Thus, it is crucial to strike a balance between pre-aggregation and flexibility.
But this data is not that easy to manage since a lot of the data that we produce today is unstructured. In fact, 95% of organizations acknowledge the need to manage unstructured rawdata since it is challenging and expensive to manage and analyze, which makes it a major concern for most businesses.
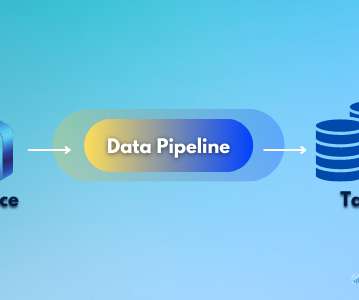
Data storage The tools mentioned in the previous section are instrumental in moving data to a centralized location for storage, usually, a cloud data warehouse, although data lakes are also a popular option. But this distinction has been blurred with the era of cloud data warehouses.
Below we list the core duties that this data specialist may undertake. Data modeling. One of the core responsibilities of an analytics engineer is to model rawdata into clean, tested, and reusable datasets. Transformations may include. splitting a single column into multiple ones, to name a few.
For example, Online Analytical Processing (OLAP) systems only allow relational data structures so the data has to be reshaped into the SQL-readable format beforehand. In ELT, rawdata is loaded into the destination, and then it receives transformations when it’s needed. ELT allows them to work with the data directly.
Keeping data in data warehouses or data lakes helps companies centralize the data for several data-driven initiatives. While data warehouses contain transformed data, data lakes contain unfiltered and unorganized rawdata.
Maintain Clean Reports Power BI report is a detailed summary of the large data set as per the criteria given by the user. They comprise tables, data sets, and data fields in detail, i.e., rawdata. Working with rawdata is challenging, so it is best advised to keep data clean and organized.
Pivot Tables allow you to retrieve answers to a series of simple questions about your data with minimum effort when given an input table containing tens, scores, or even thousands of rows. It helps aggregatedata by any field (column) and do complex computations on it.
Encoding categorical variables, scaling numerical features, creating new features, aggregatingdata. One-hot encoding categorical variables, standardizing numerical features, aggregatingdata. Best Data cleaning tools and software Data cleaning is a crucial step in data preparation, ensuring data accuracy and reliability.
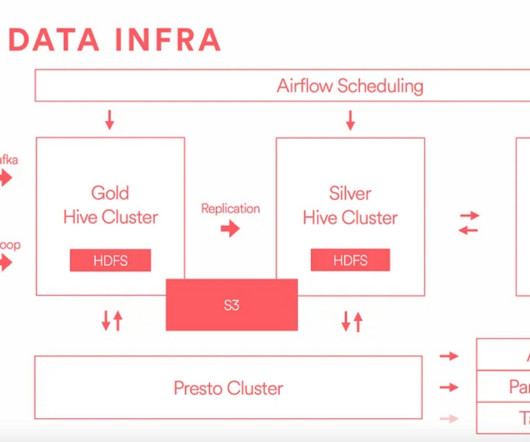
Python for Data Engineering Use Cases Data engineering, at its core, is about preparing “big data” for analytical processing. It’s an umbrella that covers everything from gathering rawdata to processing and storing it efficiently. csv') data_excel = pd.read_excel('data2.xlsx')
Observability platforms not only supply rawdata but also offer actionable insights through visualizations, dashboards, and alerts. Scalability: Observability platforms are built to scale with the growth of a business’s infrastructure. 6 Observability Platforms You Should Know 1.
Example: Imagine that your team is analyzing sales data for an internet consumer company with millions of transactions that happen weekly. QuickSight's SPICE engine stores the aggregateddata in memory, allowing very fast query response times.
Within no time, most of them are either data scientists already or have set a clear goal to become one. Nevertheless, that is not the only job in the data world. And, out of these professions, this blog will discuss the data engineering job role. to accumulate data over a given period for better analysis.
Data engineers and data scientists work very closely together, but there are some differences in their roles and responsibilities. Data Engineer Data scientist The primary role is to design and implement highly maintainable database management systems. What are the daily responsibilities of a data engineer?
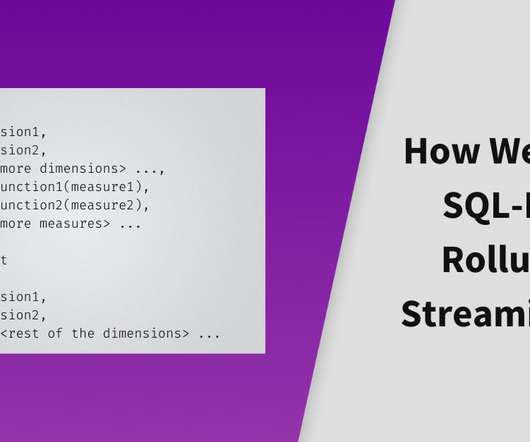
These real- and near-real-time use cases dramatically narrow the time windows for both data freshness and query speeds while amping up the risk for data errors. Rockset not only continuously ingests data, but also can “rollup” the data as it is being generated.
Since then, many other well-loved terms, such as “data economy,” have come to be widely used by industry experts to describe the influence and importance of big data in today’s society. Data Compression: This involves applying transformations to obtain a compressed representation of the original data.
We organize all of the trending information in your field so you don't have to. Join 37,000+ users and stay up to date on the latest articles your peers are reading.
You know about us, now we want to get to know you!
Let's personalize your content
Let's get even more personalized
We recognize your account from another site in our network, please click 'Send Email' below to continue with verifying your account and setting a password.


Let's personalize your content