This site uses cookies to improve your experience. To help us insure we adhere to various privacy regulations, please select your country/region of residence. If you do not select a country, we will assume you are from the United States. Select your Cookie Settings or view our Privacy Policy and Terms of Use.
Cookie Settings
Cookies and similar technologies are used on this website for proper function of the website, for tracking performance analytics and for marketing purposes. We and some of our third-party providers may use cookie data for various purposes. Please review the cookie settings below and choose your preference.
Used for the proper function of the website
Used for monitoring website traffic and interactions
Cookie Settings
Cookies and similar technologies are used on this website for proper function of the website, for tracking performance analytics and for marketing purposes. We and some of our third-party providers may use cookie data for various purposes. Please review the cookie settings below and choose your preference.
Strictly Necessary: Used for the proper function of the website
Performance/Analytics: Used for monitoring website traffic and interactions
Firms use business analytics to improve decision-making. It has several key components: Descriptive Analytics: It is a part of Business AnalyticsApplications. Business AnalyticsApplications Business analytics have many real-world uses. What software is used for business analytics?
Data Analysis Tools- How does Big Data Analytics Benefit Businesses? Top 15 Data Analysis Tools to Explore in 2025 | Trending Data Analytics Tools 1. Power BI 4. Looker Data Analytics Tools Comparison Analyze Data Like a Pro with These Data Analysis Tools FAQs on Data Analysis Tools Data Analysis Tools- What are they?
Custom notebooks generated from nteract are also included in Synapse Analytics and can be used for interactive data processing and visualization. HDInsight's Spark clusters offer connectors for BIapplications like Power BI for data analytics.
Kinesis Firehose helps secure the loading of massive streaming data into data sources, data centers, and analyticsapplications. Databricks makes it simple and efficient for you to find and share your valuable insights due to its strong integration with Power BI. For instance, Power BI users can create aggregation tables.
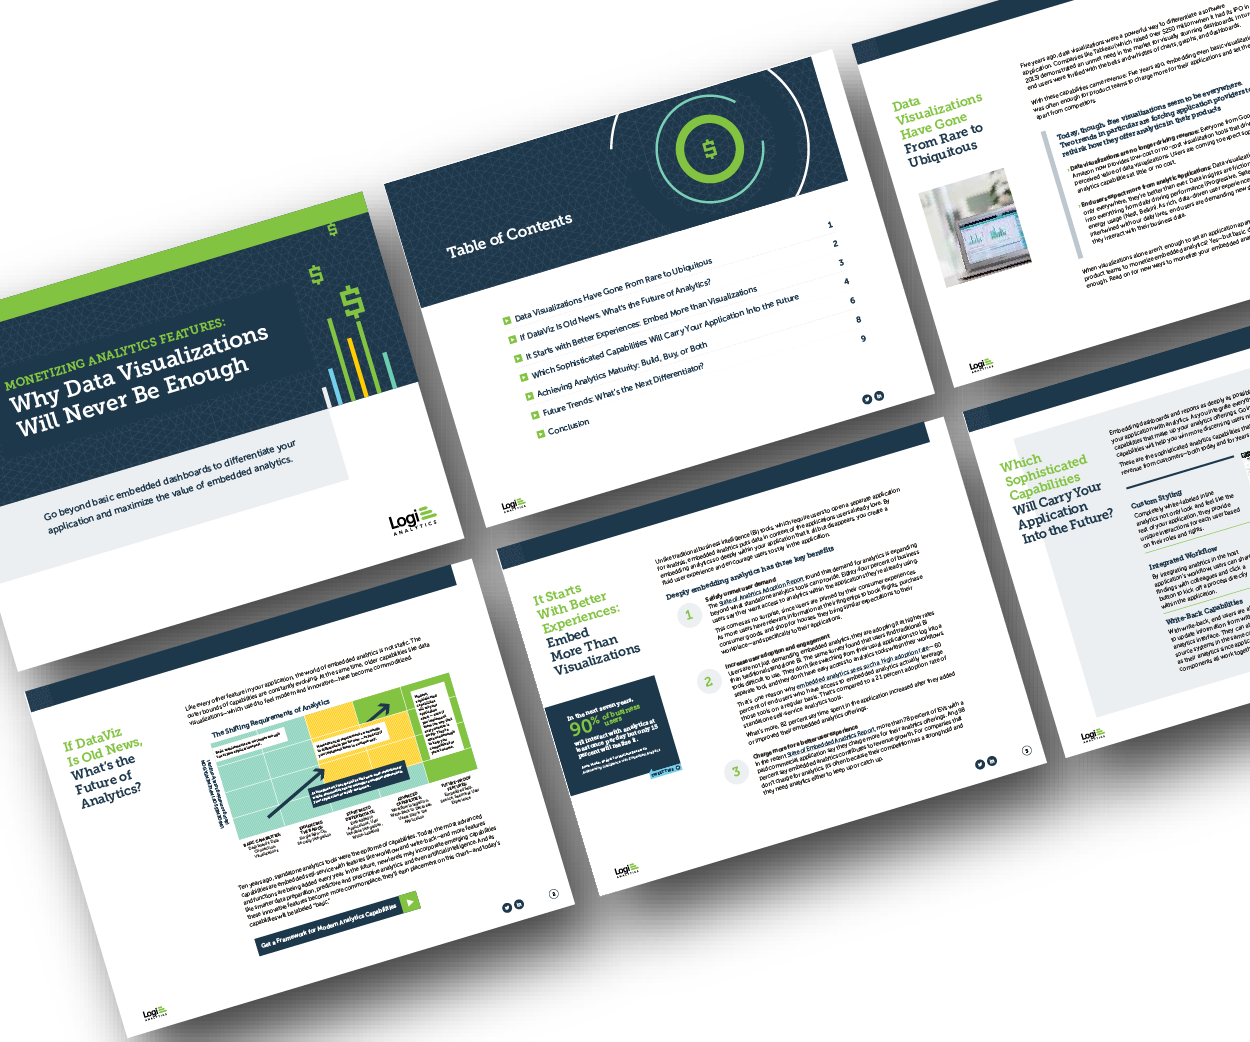
Think your customers will pay more for data visualizations in your application? Discover which features will differentiate your application and maximize the ROI of your embedded analytics. Brought to you by Logi Analytics. Five years ago they may have. But today, dashboards and visualizations have become table stakes.
BI tools are different types of application software that collect and process huge amounts of unstructured data from internal and external sources. Any business user may quickly resolve difficulties using current and skilled Business Intelligence (BI) technologies, even without intensive IT participation. Introduction.
Bi-directional data flow between the legacy system and the cloud system allows you to have users on both sides. You end up having data flowing in the right format for your cloud analytics solution. This unlimited testing minimizes your risks. The time pressure is gone, and you can be comfortable with your move to the cloud.
Bi-directional data flow between the legacy system and the cloud system allows you to have users on both sides. You end up having data flowing in the right format for your cloud analytics solution. This unlimited testing minimizes your risks. The time pressure is gone, and you can be comfortable with your move to the cloud.
Next-gen product analytics is now warehouse-native, an architectural approach that allows for the separation of code and data. In this model, providers of next-gen product analytics maintain code for the analyticalapplication as a connected app, while customers manage the data in their own cloud data platform.
AWS DevOps Real-Time Projects Below are two AWS DevOps real-time project ideas for those who want to work with real-time data using AWS DevOps- Real-Time IoT Data Analytics Using AWS IoT Tools And Technologies: AWS IoT Core, Amazon Kinesis or Amazon S3, AWS QuickSight/ Tableau/ Power BI, Machine Learning. PREVIOUS NEXT <
Introducing ADBC: Database Access for Apache Arrow — When I see "minimal-overhead alternative to JDBC/ODBC for analyticalapplications" I'm instantly in. Qlik and Talend are two old BI giants. I think this is even relevant to data world. You can also listen a related podcast about Arrow vision.
In this episode Dan DeMers, Cinchy’s CEO, explains how their concept of a "Dataware" platform eliminates the need for costly and error prone integration processes and the benefits that it can provide for transactional and analyticalapplication design. No more scripts, just SQL. No more scripts, just SQL.
Most traditional analyticsapplications like Hive, Spark, Impala, YARN etc. Hive, Spark, Impala, YARN, BI tools with S3 connectors can interact with Ozone using the s3a protocol. Protocols provided by Ozone: ofs ofs is a Hadoop Compatible File System (HCFS) protocol.
The company targets to deliver values to its customers through the free SaaS based analyticsapplications so that it can build credibility with the clients to encourage them to buy more. The products and services of Cloudera are changing the economics of big data analysis , BI, data processing and warehousing through Hadooponomics.
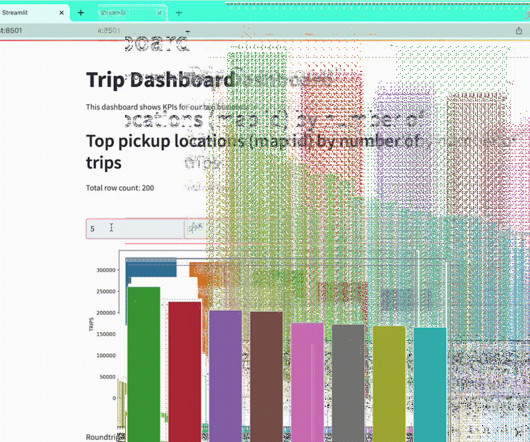
As data practitioners we want (and love) to build applications on top of our data as seamlessly as possible. Whether you work in BI, Data Science or ML all that matters is the final application and how fast you can see it working end-to-end. A lightinign fast analytics app built with our system. Image from the authors.
It has the key elements of fast ingest, fast storage, and immediate querying for BI purposes. These include stream processing/analytics, batch processing, tiered storage (i.e. Analytics storage engine for huge volumes of fast arriving data. Interactive query engine for fast BI over huge volumes of data. Spark Streaming.
It streamlines the development of intuitive, self-serve analyticsapplications for business users, while providing industry-leading accuracy. Historically, business users have primarily relied on BI dashboards and reports to answer their data questions.
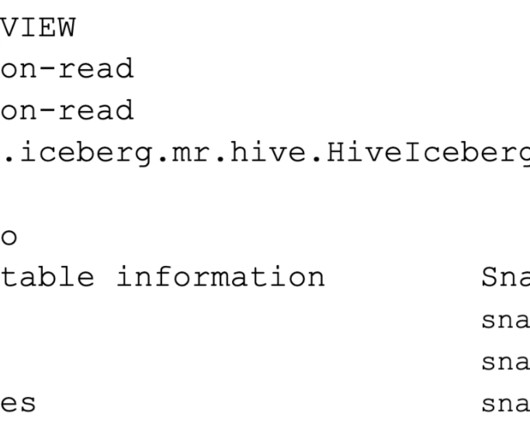
Materialized views are valuable for accelerating common classes of business intelligence (BI) queries that consist of joins, group-bys and aggregate functions. Such a query pattern is quite common in BI queries. Apache Iceberg forms the core foundation for Cloudera’s Open Data Lakehouse with the Cloudera Data Platform (CDP).
In addition to Business Intelligence (BI), Process Mining is no longer a new phenomenon, but almost all larger companies are conducting this data-driven process analysis in their organization. This aspect can be applied well to Process Mining, hand in hand with BI and AI.
BI encourages using historical data to promote fact-based decision-making instead of assumptions and intuition. What is Business Intelligence (BI)? Business intelligence (BI) is the collective name for a set of processes, systems, and technologies that turn raw data into knowledge that can be used to operate enterprises profitably.
Introduction to Big Data Big data combines structured, semi-structured, and unstructured data collected by organizations to glean valuable insights and information using machine learning, predictive modeling , and other advanced analyticalapplications. Data is visualized through meaningful charts, plots, and graphs.
Let’s explore five ways to run MongoDB analytics, along with the pros and cons of each method. 1 – Query MongoDB Directly The first and most direct approach is to run your analytical queries directly against MongoDB. There are quite a few of these on the market, with each trying to enable business intelligence (BI) on MongoDB.
We’re excited to announce that Rockset’s new connector with Snowflake is now available and can increase cost efficiencies for customers building real-time analyticsapplications. What’s Needed for Real-Time Analytics? These real-time, user-facing applications include personalization , gamification or in-app analytics.
A typical approach that we have seen in customers’ environments is that ETL applications pull data with a frequency of minutes and land it into HDFS storage as an extra Hive table partition file. In this way, the analyticapplications are able to turn the latest data into instant business insights. Design Detail.
A rapidly expanding data visualization tool called Tableau Software is creating a stir within Business Intelligence (BI) sector. What distinguishes Tableau and Power BI from one another? In contrast, Power BI’s high degree of integration will enable us to create effective dashboards from an executive perspective.
It is an alternative to business intelligence and data visualization tools like Microsoft's Power BI and Tableau. Kinesis Video streams: This helps you to stream videos in real-time from hundreds of camera devices to the AWS cloud, where you can watch, store ML operations, real-time analytics, and get insights.
Building real-time data analytics pipelines is a complex problem, and we saw customers struggle using processing frameworks such as Apache Storm, Spark Streaming, and Kafka Streams. . SSB can materialize the results from a streaming SQL query to a persistent view of the data that can be read via a REST API.
Complex SQL queries have long been commonplace in business intelligence (BI). Or a market news provider that needs to monitor and ensure that its financial customers are getting accurate, relevant updates within the narrow windows for profitable trades. Hive implemented an SQL layer on Hadoop’s native MapReduce programming paradigm.
This leads to extra cost, effort, and risk to stitch together a sub-optimal platform for multi-disciplinary, cloud-based analyticsapplications. Instead, they have separate data stores and inconsistent (if any) frameworks for data governance, management, and security. Further, much of the value of cloud is for elastic workloads.
Now we are releasing the reference architecture for you build your own self-managed SDX foundation for all your cloud-based data and analyticsapplications. We announced SDX at Strata New York in September 2017. Best of all, SDX is part of Cloudera’s core platform, not an expensive add-on.
Business intelligence solutions like as Power BI, Tableau, and Looker may assist companies in mitigating operational risk and achieving maximum efficiency in terms of operations enablement by assisting businesses in making choices that are supported by data.
In the world of batch analytics and BI dashboards you knew exactly what data you needed and what type of questions your business was asking - which gave you the luxury of setting up all sorts of pipelines to format the data exactly as needed, create materialized views, optimize the queries.
Disclaimer: Rockset is a real-time analytics database and one of the pieces in the modern real-time data stack So What is Real-Time Data (And Why Can’t the Modern Data Stack Handle It)? Real-time data streams typically power analytical or data applications whereas batch systems were built to power static dashboards.
The main purpose of a DW is to enable analytics: It is designed to source raw historical data, apply transformations, and store it in a structured format. This type of storage is a standard part of any business intelligence (BI) system, an analytical interface where users can query data to make business decisions.
Hadoop fits heavy, not time-critical analyticsapplications that generate insights for long-term planning and strategic decisions. The Good and the Bad of Power BI Data Visualization. Hadoop works with batches while Kafka deals with streams, but all the same, the similarities are obvious. Kafka vs ETL.
Top Hiring Companies Companies such as Tata Consultancy Services, Capgemini, USEReady, Dell Technologies, Accenture, Wipro, Hewlett Packard Enterprises (HPE), IBM, Visual BI solutions, etc., are regularly hiring Business Intelligence analysts. regularly hire Data Engineers in India.
Streaming data feeds many real-time analyticsapplications, from logistics tracking to real-time personalization. Change data capture (CDC) streams from OLTP databases, which may provide sales, demographic or inventory data, are another valuable source of data for real-time analytics use cases.
This makes the data ready for consumption by BI tools, analyticsapplications, or other systems. Publish: Transformed data is then published either back to on-premises sources like SQL Server or kept in cloud storage. Manage Workflow: ADF manages these processes through time-sliced, scheduled pipelines.
Arcadia Enterprise runs within the Cloudera data platform and enables business intelligence (BI) and rich visual analyticapplications to be built for hundreds of business users working on data in Hadoop.
You will acquire the skills necessary to combine, process, and organize data from different structured and unstructured data sources into frameworks appropriate for constructing analyticsapplications that make use of Microsoft Azure data services.
The company targets to deliver values to its customers through the free SaaS based analyticsapplications so that it can build credibility with the clients to encourage them to buy more. The products and services of Cloudera are changing the economics of big data analysis , BI, data processing and warehousing through Hadooponomics.
Because it integrates easily with S3, is serverless, and uses a familiar language, Athena has become the default service for most business intelligence (BI) decision makers to query the large amounts of (usually streaming) data coming into their object stores.
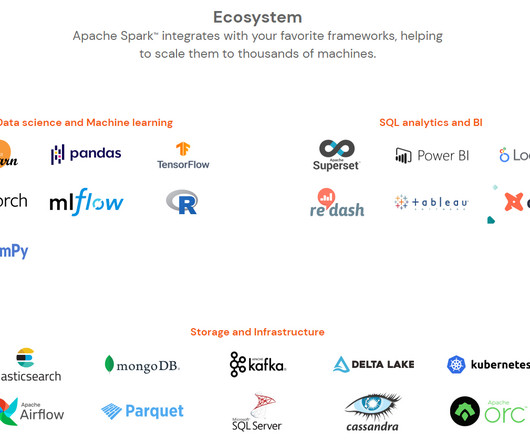
It has in-memory computing capabilities to deliver speed, a generalized execution model to support various applications, and Java, Scala, Python, and R APIs. Spark Streaming enhances the core engine of Apache Spark by providing near-real-time processing capabilities, which are essential for developing streaming analyticsapplications.
These reports can be in the form of PowerPoint Decks, Excel Dashboards, or a report from any visualization tool like Tableau, Power BI, or QlikView. These analytic projects will take you through everything you need to know as a data analyst and how to build and deploy an ETL pipeline to combine it with the analyticsapplication.
We organize all of the trending information in your field so you don't have to. Join 37,000+ users and stay up to date on the latest articles your peers are reading.
You know about us, now we want to get to know you!
Let's personalize your content
Let's get even more personalized
We recognize your account from another site in our network, please click 'Send Email' below to continue with verifying your account and setting a password.


Let's personalize your content