This site uses cookies to improve your experience. To help us insure we adhere to various privacy regulations, please select your country/region of residence. If you do not select a country, we will assume you are from the United States. Select your Cookie Settings or view our Privacy Policy and Terms of Use.
Cookie Settings
Cookies and similar technologies are used on this website for proper function of the website, for tracking performance analytics and for marketing purposes. We and some of our third-party providers may use cookie data for various purposes. Please review the cookie settings below and choose your preference.
Used for the proper function of the website
Used for monitoring website traffic and interactions
Cookie Settings
Cookies and similar technologies are used on this website for proper function of the website, for tracking performance analytics and for marketing purposes. We and some of our third-party providers may use cookie data for various purposes. Please review the cookie settings below and choose your preference.
Strictly Necessary: Used for the proper function of the website
Performance/Analytics: Used for monitoring website traffic and interactions
Conclusion Data engineering is driving innovation in every major business, from making shopping more personalized to making sure self-driving cars are safer and healthcare is smarter. It is an important part of our data-driven world because it can turn rawdata into ideas that can be used.
KAWA Analytics is the ultimate data application builder, combining AI-powered analytics and automation to help businesses create custom applications effortlessly. Enterprises need to rapidly transform rawdata into actionable applications, but this often requires expensive infrastructure, coding, custom dataanalysis and complex integrations.
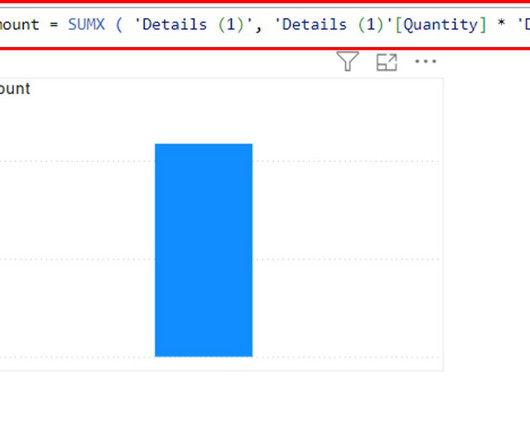
Formulae and expressions in Power BI are created using a set of functions, operators, and constants called DataAnalysis Expressions (DAX). It’s among the most adaptable DAX functions for combining data to produce more precise and perceptive reports. SumX Power BI can help you improve your dataanalysis.
Tableau filters are like the secret sauce that turns rawdata into meaningful insights. Each filter has its own unique role, helping you slice and dice your data just the way you need.
Faster, easier AI/ML and data engineering workflows Explore, analyze and visualize data using Python and SQL. Discover valuable business insights through exploratory dataanalysis. Develop scalable data pipelines and transformations for data engineering.
RAPIDS on the Cloudera Data Platform comes pre-configured with all the necessary libraries and dependencies to bring the power of RAPIDS to your projects. RAPIDS brings the power of GPU compute to standard Data Science operations, be it exploratory dataanalysis, feature engineering or model building. Data Ingestion.
The data and the techniques presented in this prototype are still applicable as creating a PCA feature store is often part of the machine learning process. . The process followed in this prototype covers several steps that you should follow: Data Ingest – move the rawdata to a more suitable storage location.
Additionally, data scientists should know the distinctions between Deep Learning and Machine Learning. Foundational Data Science Skills 1. Data Visualization In simple terms, data visualization is a visual representation of data that conveys a message or dataanalysis outcomes.
. “Unit imputation” means replacing a whole data point, while “item imputation” means replacing part of a data point. Missing information can cause bias, make dataanalysis harder, and lower efficiency. What Is Data Imputation? This process is important for keeping dataanalysis accurate.
Both data science and software engineering rely largely on programming skills. However, data scientists are primarily concerned with working with massive datasets. Data Science is strongly influenced by the value of accurate estimates, dataanalysis results, and understanding of those results.
Taking data from sources and storing or processing it is known as data extraction. Define Data Wrangling The process of data wrangling involves cleaning, structuring, and enriching rawdata to make it more useful for decision-making. Data is discovered, structured, cleaned, enriched, validated, and analyzed.
A data scientist is a person who is trained and experienced in working with data, i.e. data gathering, data cleaning, data preparation, data transformation, and dataanalysis. These steps will help understand the data, extract hidden patterns and put forward insights about the data.
In this article, we will be discussing 4 types of d ata Science Projects for resume that can strengthen your skills and enhance your resume: Data Cleaning Exploratory DataAnalysisData Visualization Machine Learning Data Cleaning A data scientist, most likely spend nearly 80% of their time cleaning data.
Features: Effective Cost Analysis Simple UI and intuitive dashboards Usage Trend and Resource Cost Analytics Gives Recommendations for unused resources, downscaling, relocation, and reallocations 6. Informatica Informatica is a leading industry tool used for extracting, transforming, and cleaning up rawdata.
Dataanalysis and Interpretation: It helps in analyzing large and complex datasets by extracting meaningful patterns and structures. By identifying and understanding patterns within the data, valuable insights can be gained, leading to better decision-making, and understanding of underlying relationships.
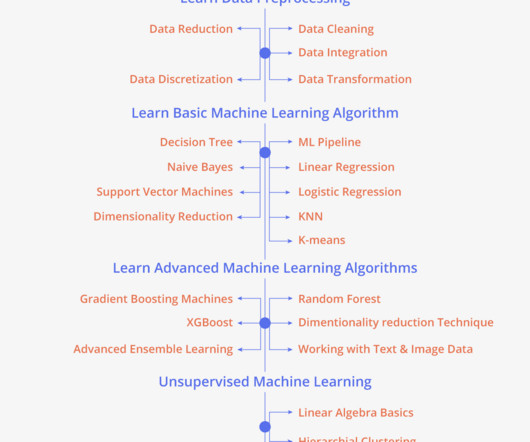
This is important because this will help you understand what areas to focus on while following the Data Science Learning Path. Is it the part where you turn rawdata into useful ones, or it the part where you engineer new features out of the existing ones in order to help create suitable models?
Data Science initiatives from an operational standpoint help organizations optimize various aspects of their business, such as supply chain management , inventory segregation, and management, demand forecasting, etc. A data analyst would be a professional who will be able to accomplish all the tasks mentioned in the process of dataanalysis.
Businesses benefit at large with these data collection and analysis as they allow organizations to make predictions and give insights about products so that they can make informed decisions, backed by inferences from existing data, which, in turn, helps in huge profit returns to such businesses.
Some of these limitations are due to the way spatial indexing stores the leaves in the data. It turns out that the way the rawdata is distributed affects how bounding boxes are placed into the R-tree. Are there cases when it offers no benefits?
Audio Toolbox by MathWorks offers numerous instruments for audio data processing and analysis, from labeling to estimating signal metrics to extracting certain features. It also comes with pretrained machine learning and deep learning models that can be used for speech analysis and sound recognition. Audio dataanalysis steps.
Organisations and businesses are flooded with enormous amounts of data in the digital era. Rawdata, however, is frequently disorganised, unstructured, and challenging to work with directly. Data processing analysts can be useful in this situation. What does a Data Processing Analysts do ?
Because of their smaller size, which reduces processing latency, they are perfect for AI customer support, real-time dataanalysis, and other applications where speed is crucial. This is due to the fact that they are not sufficiently refined and that they are trained using publicly available, publicly published rawdata.
Introduction Data visualization is critical in this digital age. Tableau Software has seen extensive usage in making businesses more data-driven. A premier tool for dataanalysis and business intelligence, Tableau is used to visualize business data.
Welcome to the comprehensive guide for beginners on harnessing the power of Microsoft's remarkable data visualization tool - Power BI. In today's data-driven world, the ability to transform rawdata into meaningful insights is paramount, and Power BI empowers users to achieve just that. What is Power BI?
In today's data-driven world, where information reigns supreme, businesses rely on data to guide their decisions and strategies. However, the sheer volume and complexity of rawdata from various sources can often resemble a chaotic jigsaw puzzle. What Is Data Wrangling?
Business Intelligence and Artificial Intelligence are popular technologies that help organizations turn rawdata into actionable insights. While both BI and AI provide data-driven insights, they differ in how they help businesses gain a competitive edge in the data-driven marketplace.
There are several interrelated professions in the data mining industry, including business analyst and statistician. Learning Outcomes: This data concentration will provide you a solid grounding in mathematics and statistics as well as extensive experience with computing and dataanalysis.
Their operations require collaborations with different team members fulfilling front-end and back-end requirements, including dataanalysis. Data Engineer Data engineers develop or strategize software to retrieve, sort, and process rawdata to extract meaningful information to assess an operation.
Workspace is the platform where power BI developers create reports, dashboards, data sets, etc. Dataset is the collection of rawdata imported from various data sources for the purpose of analysis. DirectQuery and Live Connection: Connecting to data without importing it, ideal for real-time or large datasets.
This involves continually striving to reduce wasted effort, identify gaps and correct them, and improve data development and deployment processes. While definitions of each of these roles may vary across organizations, each is responsible for making data available to data analysts, scientists, and other team members who depend on it.
Only expert professionals with a thorough understanding of business intelligence tools can do this job by creating meaningful reports from the rawdata sets. Key takeaways of BI are: It parses rawdata and turns it into meaningful chunks of information, using which the managers can make better growth decisions.
Third-Party Data: External data sources that your company does not collect directly but integrates to enhance insights or support decision-making. These data sources serve as the starting point for the pipeline, providing the rawdata that will be ingested, processed, and analyzed.
Enter the world of data clean rooms – the super secure havens where you can mix and mingle data from different sources to get insights without getting your hands dirty with the rawdata. How data clean rooms work Data clean rooms combine and analyze different data sources without directly accessing the rawdata.
Critical Thinking Because they must match the client's expectations with their analysis of the data, business analysts need to be able to think critically. Business analysts must therefore put business requirements and dataanalysis in order of importance, considering several factors.
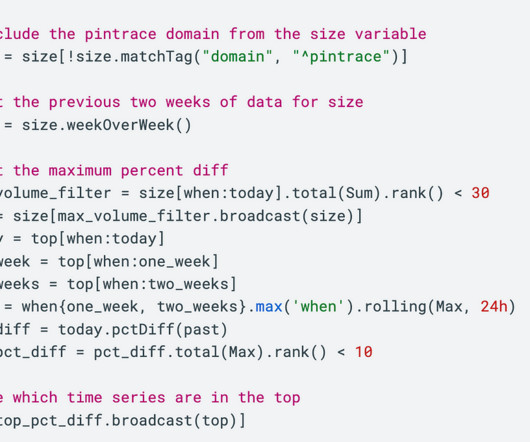
Foundation TScript is built with: pandas : to structure and handle the time series data pyparsing : to parse the TScript language Pandas is a dataanalysis library that has a built-in data structure, the DataFrame , designed for handling time series data.
Dataanalysis, statistical models, and other quantitative techniques are used in business analytics (BA), a collection of disciplines and technology. It entails a rigorous, iterative examination of the data within an organization with a focus on statistical analysis to inform decision-making.
Programming Languages for Data Scientists Here are the top 11 programming languages for data scientists, listed in no particular order: 1. Due to its strong dataanalysis and manipulation skills, it has significantly increased its prominence in the field of data science. Embark on Your Data Science Journey Today!
A data engineer is an engineer who creates solutions from rawdata. A data engineer develops, constructs, tests, and maintains data architectures. Let’s review some of the big picture concepts as well finer details about being a data engineer. Earlier we mentioned ETL or extract, transform, load.
In today's data-driven world, businesses and organizations rely heavily on data to make informed decisions and gain a competitive edge. This has increased the demand for professionals skilled in dataanalysis and visualization tools. You may wonder if the Power BI Certification Path is worth pursuing or not.
Not very surprisingly, the amount of data used and shared between networks is infinite. This has led to dataanalysis being a vital element of most businesses. Data analysts are professionals who manage and analyze data that give insight into business goals and help align them. What is DataAnalysis?
More importantly, we will contextualize ELT in the current scenario, where data is perpetually in motion, and the boundaries of innovation are constantly being redrawn. Extract The initial stage of the ELT process is the extraction of data from various source systems. What Is ELT? So, what exactly is ELT?
To obtain a data science certification, candidates typically need to complete a series of courses or modules covering topics like programming, statistics, data manipulation, machine learning algorithms, and dataanalysis. You will learn about Python, SQL, statistical modeling and dataanalysis.
Data visualization charts are an invaluable tool in simplifying dataanalysis and presenting insights in visually appealing ways. Data visualization charts are graphical representations of data that help organizations understand and interpret complex information.
ETL Architecture on AWS: Examining the Scalable Architecture for Data Transformation ETL Architecture on AWS typically consists of three components - Source Data Store A Data Transformation Layer Target Data Store Source Data Store The source data store is where rawdata is stored before being transformed and loaded into the target data store.
We organize all of the trending information in your field so you don't have to. Join 37,000+ users and stay up to date on the latest articles your peers are reading.
You know about us, now we want to get to know you!
Let's personalize your content
Let's get even more personalized
We recognize your account from another site in our network, please click 'Send Email' below to continue with verifying your account and setting a password.


Let's personalize your content