This site uses cookies to improve your experience. To help us insure we adhere to various privacy regulations, please select your country/region of residence. If you do not select a country, we will assume you are from the United States. Select your Cookie Settings or view our Privacy Policy and Terms of Use.
Cookie Settings
Cookies and similar technologies are used on this website for proper function of the website, for tracking performance analytics and for marketing purposes. We and some of our third-party providers may use cookie data for various purposes. Please review the cookie settings below and choose your preference.
Used for the proper function of the website
Used for monitoring website traffic and interactions
Cookie Settings
Cookies and similar technologies are used on this website for proper function of the website, for tracking performance analytics and for marketing purposes. We and some of our third-party providers may use cookie data for various purposes. Please review the cookie settings below and choose your preference.
Strictly Necessary: Used for the proper function of the website
Performance/Analytics: Used for monitoring website traffic and interactions
Advanced analytics help manufacturers extract insights from their data and improve operations and decision-making. But for manufacturers, it’s often challenging to perform analytics with ERP data. A fragmented resource planning system causes data silos, making enterprise-wide visibility virtually impossible.
But 85% accuracy in the supply chain means you have no manufacturing operations. A big retailer might partner with the manufacturer and a distributor to share information on demand or intervention on pricing elasticity or about available supply. Retail manufacturing distribution is a natural value chain. These are all minor.
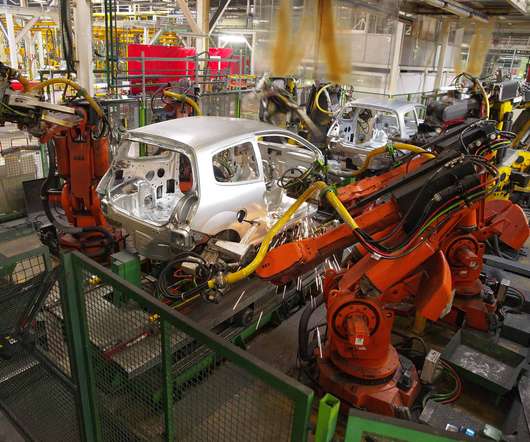
Confluent Cloud enables organizations to unlock real-time visibility into manufacturing processes, using real-time datacollection and analytics to prevent re-work and tooling failures, delivering an outsized impact on production volume and quality.
You can read part 1, here: Digital Transformation is a Data Journey From Edge to Insight. The first blog introduced a mock connected vehicle manufacturing company, The Electric Car Company (ECC), to illustrate the manufacturingdata path through the data lifecycle. 1 The enterprise data lifecycle.
The data journey is not linear, but it is an infinite loop data lifecycle – initiating at the edge, weaving through a data platform, and resulting in business imperative insights applied to real business-critical problems that result in new data-led initiatives. Fig 1: The Enterprise Data Lifecycle.
The report classified employees’ reasons for leaving into six broad categories such as growth opportunity and job security, demonstrating the importance of using performance data, datacollected from voluntary departures and historical data to reduce attrition for strong performers and enhance employees’ well-being.
This blog series follows the manufacturing and operations data lifecycle stages of an electric car manufacturer – typically experienced in large, data-driven manufacturing companies. The first blog introduced a mock vehicle manufacturing company, The Electric Car Company (ECC) and focused on DataCollection.
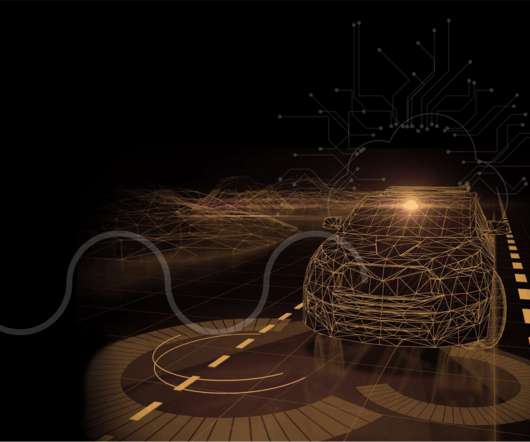
The goal is to define, implement and offer a data lifecycle platform enabling and optimizing future connected and autonomous vehicle systems that would train connected vehicle AI/ML models faster with higher accuracy and delivering a lower cost. connected manufacturing, and connected vehicles, see more of his perspective at [link].
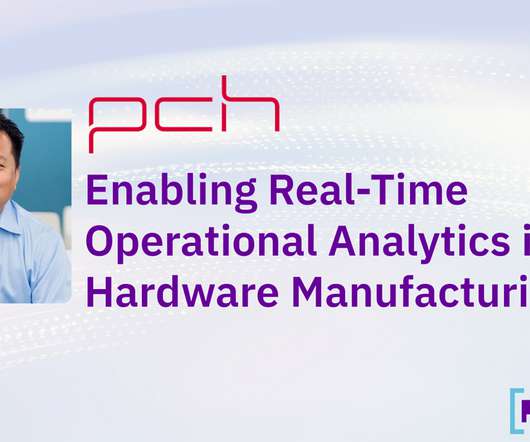
Summary: PCH International is a leading hardware manufacturer with global operations that requires ultra-fast analysis of huge volumes of streaming data. The existing data infrastructure built on MongoDB and DynamoDB couldn’t support real-time querying of data.
Meanwhile, 79% of industry professionals said gen AI has the potential to revolutionize drug manufacturing in terms of quality and efficiency. They can accelerate research and discovery, optimize manufacturing, enhance commercialization, reduce costs and, ultimately, improve patient outcomes.
The availability and maturity of automated datacollection and analysis systems is making it possible for businesses to implement AI across their entire operations to boost efficiency and agility. Artificial intelligence (AI) has been a focus for research for decades, but has only recently become truly viable.
They will create a plan for the datacollection. All the data about the baseline and the updated project charter is measured in Phase-2 of DMAIC. Analyze All the data that is collected and measured in Phase-2 is analyzed in Phase-3 of the DMAIC. Lean Six Sigma Case Studies 1.
That may extend to knowing (and controlling) the specific paths across which data transits, how it is stored, and the privacy and tamper-resistance compliance mechanisms employed. CSPs could become involved in the “networked cloud” and data-management across these areas — but they need to look beyond narrow views of edge-compute. .
What is the current state of the art for accessing and analyzing data for wind farms? How uniform is the availability and formatting of data from different manufacturers? How are you handling datacollection for the individual turbines? How are you handling datacollection for the individual turbines?
Table 1: Classifying item name tokens to product attributes Building an attribute extraction model Building an in-house attribute extraction/tagging model from scratch requires a significant amount of labeled training data to reach the desired accuracy. This is often known as the cold-start problem of natural language processing , or NLP.
Aiming at understanding sound data, it applies a range of technologies, including state-of-the-art deep learning algorithms. Audio analysis has already gained broad adoption in various industries, from entertainment to healthcare to manufacturing. Audio data transformation basics to know. Below we’ll give most popular use cases.
I nformation must be extracted from this data to make sense of it, and we must gain insights from th is information that will help us to understand repeating patterns. This is where Data Science comes into the picture. It looks like this: Datacollection This part deals with the collection of raw data from various resources.
It refers to the use of data acquired from internet-connected devices. The datacollected is then used to analyze, track, and predict human behavior. This can be observed in manufacturing, healthcare, and even the home. A variety of Cloud Computing courses are available to help you catch up with speed.
Predictive maintenance monitoring seeks to strike a balance by using real-time data and analytics to forecast when equipment will fail. Consequently, many industries, including manufacturing, energy, transportation, and healthcare, are adopting predictive maintenance as their preferred strategy.
With the rise of streaming architectures and digital transformation initiatives everywhere, enterprises are struggling to find comprehensive tools for data management to handle high volumes of high-velocity streaming data. He currently works at Cloudera, managing their Data-in-Motion product line.
In the second blog of the Universal Data Distribution blog series , we explored how Cloudera DataFlow for the Public Cloud (CDF-PC) can help you implement use cases like data lakehouse and data warehouse ingest, cybersecurity, and log optimization, as well as IoT and streaming datacollection.
It involves extracting meaningful features from the data and using them to make informed decisions or predictions. DataCollection and Pre-processing The first step is to collect the relevant data that contains the patterns of interest. The steps involved in it can be summarized as follows: 1.
IoT: Overview IoT has numerous applications in various sectors such as healthcare, agriculture, transportation, manufacturing, and smart cities. The datacollected from IoT devices can be used to improve decision-making, optimize processes, and enhance customer experiences.
Six Sigma was first used in manufacturing as a quality control tool. Six Sigma Environmental Success: Baxter Manufacturing Baxter Manufacturing utilized Six Sigma principles to enhance its environmental performance and aim for greater efficiency. When long-term defect levels are less than 3.4
Six Sigma was first used in manufacturing as a quality control tool. Six Sigma Environmental Success: Baxter Manufacturing Baxter Manufacturing utilized Six Sigma principles to enhance its environmental performance and aim for greater efficiency. When long-term defect levels are less than 3.4
Six Sigma: Originally developed for manufacturing, but has been adapted successfully to service industries, healthcare, and more. This is achieved through datacollection, statistical analysis, statistical tools, and other tools. Six Sigma seeks to improve 100% of process outputs at reduced costs.
Learn how tesa, one of the world’s leading manufacturers of adhesive tapes and self-adhesive product solutions, combines more than 30 datasets to improve operations and take advantage of IoT technology – all through Snowflake’s Data Cloud. Snowflake allows us to do that.
If undetected, corruption of data and its information will compromise the processes that utilize that data. Personal DataCollecting and managing data carries regulatory responsibilities regarding data protection and evidence required for regulatory compliance.
Many industries, such as medicine, business, technology, defense, aerospace, marketing, and manufacturing, need a team of software developers to ensure their businesses' maximum performance and introduce innovative software and technologies. They make sure that all enterprise applications run smoothly at any cost.
Analyze Phase In this Phase we analyze all the datacollected in the measure phase and find the cause of variation. Analyze phase use various tests like parametric tests where the mean and standard deviation of the sample is known and Nonparametric Tests where the data is categorical for example as Excellent, Good, bad etc.
billion (2022) Employees: 505,000+ Services: Data analytics, consulting, technology Clients: 9,000+ Industry focus: Financial services, healthcare, retail, manufacturing, and telecommunications Accenture Analytics is a leader in the data analytics industry. Some of the key figures for Accenture Analytics include: Revenue: $50.5
The applications of math are used in many Industries like Retail, Manufacturing, IT to bring out the company overview in terms of sales, production, goods intake, wage paid, prediction of their level in the present market and much more. Analysis of data includes Condensation, Summarization, Conclusion etc.,
Cloudera Edge Management (CEM) is a key part of the CDF platform and it addresses IoT and edge data management challenges around datacollection and processing edge data from a wide range of edge devices and streaming sources. Get your free Expo Pass to IoT World and join us.
Multiple types of data exist within organizations, and it is the obligation of data architects to standardize them so that data analysts and scientists can use them interchangeably. If data scientists and analysts are pilots, data engineers are aircraft manufacturers. Which queries do you have?
So, here is what responsibilities business analyst jobs in the USA entry-level and senior level have, DatacollectionCollectingdata is the first step in business analysis. Though it sounds simple, datacollection includes various sub-segments in it.
Using Kurt’s analogy, those processes and practices are really meant to build an application, so the piece of furniture is an application or software, whereas data becomes a component of that, a leg or a bolt, or something that’s within that software application. Automate the datacollection and cleansing process.
Automation is more prevalent in the manufacturing, administrative, logistics, and optimization industries. Robotic process automation (RPA), data entry, manufacturing, etc. This is done in the following sequence: Datacollection, Data processing, Feature extraction, Model selection, Training.
Six Sigma is a management process used for quality improvement through data accumulation and analysis. Not only that, but the six sigma statistical tools also use a lean manufacturing system to rule out most unnecessary resource waste. The process also helps increase customer satisfaction.
Traditionally, the quest for labeled data involves the meticulous task of human annotation, a process both labor-intensive and financially demanding. Yet, beyond the sheer toil, there are lurking concerns of privacy, limitations in data diversity, and the uphill battle of scaling up real-world datacollection.
Example 4: To utilize my background in mechanical engineering to improve the efficiency of manufacturing processes for a leading automotive company. Example 7: To use my skills in industrial engineering to streamline operations and improve the bottom line for a manufacturing company. Example 7: A qualified Q.A.
As technology and datacollection have advanced, these charts can be generated automatically and will alert you when there is a significant variation. Control charts are most extensively used in manufacturing and more specifically in quality control. Control charts are extensively used in manufacturing.
Conversely, visualization involves presenting data visually, such as graphs, charts, and dashboards. For example, it can automate datacollection, analysis, and visualization, saving businesses time and money. Automation can also help increase accuracy and zero errors in data analysis.
For example, AI can analyze sensor data from manufacturing equipment and detect when equipment is operating outside of normal parameters. DataCollection and Management Techniques of a Qualitative Research Plan Any qualitative research calls for the collection and management of empirical data.
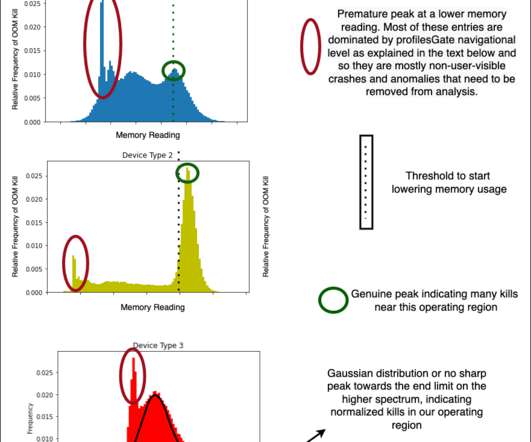
Some features (as an example) include Device Type ID, SDK Version, Buffer Sizes, Cache Capacities, UI resolution, Chipset Manufacturer and Brand. Stay tuned for further posts on memory management and the use of ML modeling to deal with systemic and low latency datacollected at the device level.
We organize all of the trending information in your field so you don't have to. Join 37,000+ users and stay up to date on the latest articles your peers are reading.
You know about us, now we want to get to know you!
Let's personalize your content
Let's get even more personalized
We recognize your account from another site in our network, please click 'Send Email' below to continue with verifying your account and setting a password.


Let's personalize your content