This site uses cookies to improve your experience. To help us insure we adhere to various privacy regulations, please select your country/region of residence. If you do not select a country, we will assume you are from the United States. Select your Cookie Settings or view our Privacy Policy and Terms of Use.
Cookie Settings
Cookies and similar technologies are used on this website for proper function of the website, for tracking performance analytics and for marketing purposes. We and some of our third-party providers may use cookie data for various purposes. Please review the cookie settings below and choose your preference.
Used for the proper function of the website
Used for monitoring website traffic and interactions
Cookie Settings
Cookies and similar technologies are used on this website for proper function of the website, for tracking performance analytics and for marketing purposes. We and some of our third-party providers may use cookie data for various purposes. Please review the cookie settings below and choose your preference.
Strictly Necessary: Used for the proper function of the website
Performance/Analytics: Used for monitoring website traffic and interactions
In this blog, well explore Building an ETL Pipeline with Snowpark by simulating a scenario where commerce data flows through distinct data layersRAW, SILVER, and GOLDEN.These tables form the foundation for insightful analytics and robust business intelligence. They need to: Consolidate rawdata from orders, customers, and products.
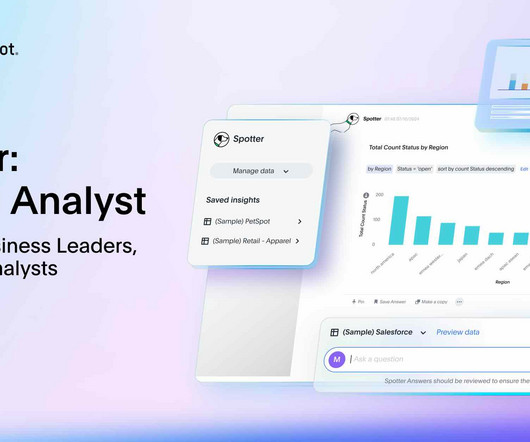
Level 2: Understanding your dataset To find connected insights in your business data, you need to first understand what data is contained in the dataset. This is often a challenge for business users who arent familiar with the source data. In this example, were asking, What is our customer lifetime value by state?
When created, Snowflake materializes query results into a persistent table structure that refreshes whenever underlying data changes. These tables provide a centralized location to host both your rawdata and transformed datasets optimized for AI-powered analytics with ThoughtSpot.
Particularly, we’ll explain how to obtain audio data, prepare it for analysis, and choose the right ML model to achieve the highest prediction accuracy. But first, let’s go over the basics: What is the audio analysis, and what makes audio data so challenging to deal with. Labeling of audio data in Audacity.
Tableau Prep is a fast and efficient datapreparation and integration solution (Extract, Transform, Load process) for preparingdata for analysis in other Tableau applications, such as Tableau Desktop. simultaneously making rawdata efficient to form insights. Choose your dataset and click Open.
There are two main steps for preparingdata for the machine to understand. Any ML project starts with datapreparation. You can’t simply feed the system your whole dataset of emails and expect it to understand what you want from it. What should it be like and how to prepare a great one?
While it’s important to have the in-house data science expertise and the ML experts on-hand to build and test models, the reality is that the actual data science work — and the machine learning models themselves — are only one part of the broader enterprise machine learning puzzle. Laurence Goasduff, Gartner.
But this data is not that easy to manage since a lot of the data that we produce today is unstructured. In fact, 95% of organizations acknowledge the need to manage unstructured rawdata since it is challenging and expensive to manage and analyze, which makes it a major concern for most businesses.
Welcome to the comprehensive guide for beginners on harnessing the power of Microsoft's remarkable data visualization tool - Power BI. In today's data-driven world, the ability to transform rawdata into meaningful insights is paramount, and Power BI empowers users to achieve just that. What is Power BI?
In today's data-driven world, where information reigns supreme, businesses rely on data to guide their decisions and strategies. However, the sheer volume and complexity of rawdata from various sources can often resemble a chaotic jigsaw puzzle.
Power BI Basics Microsoft Power BI is a business intelligence and data visualization software that is used to create interactive dashboards and business intelligence reports from various data sources. Dashboards, reports, workspace, datasets, and apps are the building blocks of power BI.
Over the years, the field of data engineering has seen significant changes and paradigm shifts driven by the phenomenal growth of data and by major technological advances such as cloud computing, data lakes, distributed computing, containerization, serverless computing, machine learning, graph database, etc.
Data testing tools: Key capabilities you should know Helen Soloveichik August 30, 2023 Data testing tools are software applications designed to assist data engineers and other professionals in validating, analyzing and maintaining data quality. There are several types of data testing tools.
What is Data Cleaning? Data cleaning, also known as data cleansing, is the essential process of identifying and rectifying errors, inaccuracies, inconsistencies, and imperfections in a dataset. It involves removing or correcting incorrect, corrupted, improperly formatted, duplicate, or incomplete data.
While the numbers are impressive (and a little intimidating), what would we do with the rawdata without context? The tool will sort and aggregate these rawdata and transport them into actionable, intelligent insights. If this trend continues to evolve, it will nearly double by 2025.
It requires extracting rawdata from claims automatically and applying NLP for analysis. Training neural networks and implementing them into your classifier can be a cumbersome task since they require knowledge of deep learning and quite large datasets. Stating categories and collecting training dataset.
Data labeling (sometimes referred to as data annotation ) is the process of adding tags to rawdata to show a machine learning model the target attributes — answers — it is expected to predict. A label or a tag is a descriptive element that tells a model what an individual data piece is so it can learn by example.
Given the rising importance of data with each passing day, I believe I will continue doing so in the coming years. Introducing Microsoft Power BI , a leading solution in this domain, which enables users to transform rawdata into insightful visualizations and reports. What Is Power BI?
Namely, AutoML takes care of routine operations within datapreparation, feature extraction, model optimization during the training process, and model selection. In the meantime, we’ll focus on AutoML which drives a considerable part of the MLOps cycle, from datapreparation to model validation and getting it ready for deployment.
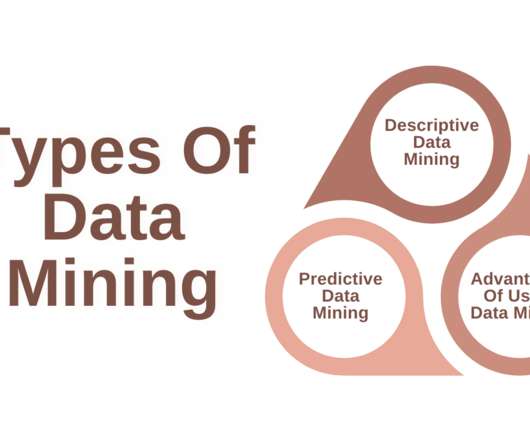
By examining these factors, organizations can make informed decisions on which approach best suits their data analysis and decision-making needs. Parameter Data Mining Business Intelligence (BI) Definition The process of uncovering patterns, relationships, and insights from extensive datasets.
As you now know the key characteristics, it gets clear that not all data can be referred to as Big Data. What is Big Data analytics? Big Data analytics is the process of finding patterns, trends, and relationships in massive datasets that can’t be discovered with traditional data management techniques and tools.
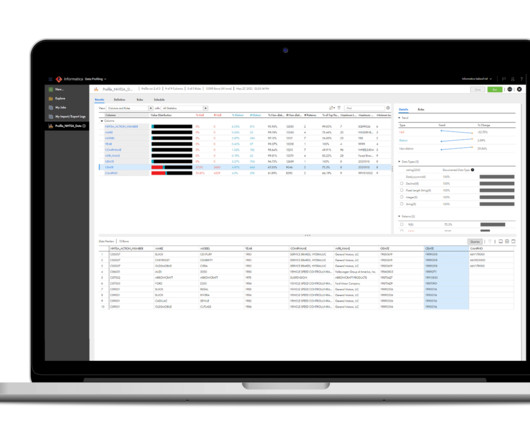
Data testing tools are software applications designed to assist data engineers and other professionals in validating, analyzing, and maintaining data quality. There are several types of data testing tools. Data profiling tools: Profiling plays a crucial role in understanding your dataset’s structure and content.
In today's world, where data rules the roost, data extraction is the key to unlocking its hidden treasures. As someone deeply immersed in the world of data science, I know that rawdata is the lifeblood of innovation, decision-making, and business progress. What is data extraction?
Big data operations require specialized tools and techniques since a relational database cannot manage such a large amount of data. Big data enables businesses to gain a deeper understanding of their industry and helps them extract valuable information from the unstructured and rawdata that is regularly collected.
Supervised learning is training a machine learning model using the labeled dataset. Organic labels are often available in data, but a process may involve a human expert that adds tags to rawdata to show a model the target attributes (answers). Supervised vs unsupervised vs semi-supervised machine learning in a nutshell.
Data Understanding – Companies must identify the data needed for the project and collect them from all available sources. DataPreparation – This is a very important step in preparing the data for analysis. It also brings out the common features of the data.
Factors Data Engineer Machine Learning Definition Data engineers create, maintain, and optimize data infrastructure for data. In addition, they are responsible for developing pipelines that turn rawdata into formats that data consumers can use easily. When necessary, train and retrain systems.
DataOps involves collaboration between data engineers, data scientists, and IT operations teams to create a more efficient and effective data pipeline, from the collection of rawdata to the delivery of insights and results. Another key difference is the types of tools and technologies used by DevOps and DataOps.
The role of a Power BI developer is extremely imperative as a data professional who uses rawdata and transforms it into invaluable business insights and reports using Microsoft’s Power BI. Define data architecture standards and best practices. Mentor team members in data modeling techniques.
Preparingdata for analysis is known as extract, transform and load (ETL). While the ETL workflow is becoming obsolete, it still serves as a common word for the datapreparation layers in a big data ecosystem. Working with large amounts of data necessitates more preparation than working with less data.
Within no time, most of them are either data scientists already or have set a clear goal to become one. Nevertheless, that is not the only job in the data world. And, out of these professions, this blog will discuss the data engineering job role. The Yelp dataset JSON stream is published to the PubSub topic.
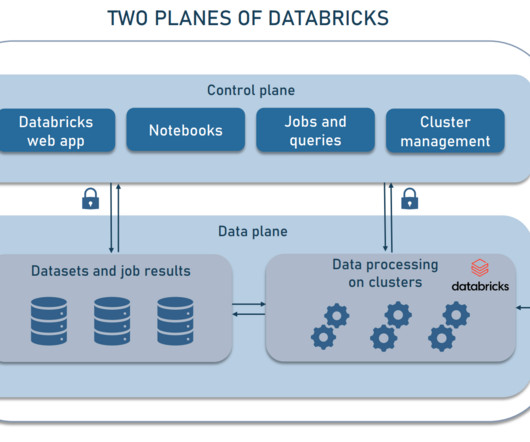
What is Databricks Databricks is an analytics platform with a unified set of tools for data engineering, data management , data science, and machine learning. It combines the best elements of a data warehouse, a centralized repository for structured data, and a data lake used to host large amounts of rawdata.
The various steps involved in the data analysis process include – Data Exploration – Having identified the business problem, a data analyst has to go through the data provided by the client to analyse the root cause of the problem. 5) What is data cleansing?
Databricks Snowflake Projects for Practice in 2022 Dive Deeper Into The Snowflake Architecture FAQs on Snowflake Architecture Snowflake Overview and Architecture With Data Explosion, acquiring, processing, and storing large or complicated datasets appears more challenging. Snowflake offers no built-in virtual private networking.
Business intelligence (BI) is the collective name for a set of processes, systems, and technologies that turn rawdata into knowledge that can be used to operate enterprises profitably. Business intelligence solutions comBIne technology and strategy for gathering, analyzing, and interpreting data from internal and external sources.
This Microsoft power BI book covers all the business intelligence skills required for a data analyst including datapreparation, modeling, visualization, report creation, deployment, dashboard design, etc. As a beginner, you will learn the core concepts of how to turn data into cool reports and charts.
It provides the first purpose-built Adaptive DataPreparation Solution(launched in 2013) for data scientist, IT teams, data curators, developers, and business analysts -to integrate, cleanse and enrich rawdata into meaningful analytic ready big data that can power operational, predictive , ad-hoc and packaged analytics.
Encoder Network Purpose : Encodes the input data xx into a latent representation zz by learning the parameters μencodermu_{text{encoder}} and σencodersigma_{text{encoder}} of the approximate posterior distribution q(z∣x)q(z|x). Architecture : Input: Rawdata xx (e.g., image pixels or text embeddings).
A data scientist’s job needs loads of exploratory data research and analysis on a daily basis with the help of various tools like Python, SQL, R, and Matlab. This role is an amalgamation of art and science that requires a good amount of prototyping, programming and mocking up of data to obtain novel outcomes.
Microsoft created Power BI, a business analytics tool that enables users to visualize and analyze data from various sources quickly and interactively. It provides a wide range of features and functionalities, including datapreparation, data modeling, data visualization, and collaboration tools.
Data Cleaning: To improve the data quality and filter the noisy, inaccurate, and irrelevant data for analysis, data cleaning is a key skill needed for all analytics job roles. Microsoft Excel: A successful Excel spreadsheet helps to organize rawdata into a more readable format. billion in 2025.
A big data project is a data analysis project that uses machine learning algorithms and different data analytics techniques on a large dataset for several purposes, including predictive modeling and other advanced analytics applications. Kicking off a big data analytics project is always the most challenging part.
We organize all of the trending information in your field so you don't have to. Join 37,000+ users and stay up to date on the latest articles your peers are reading.
You know about us, now we want to get to know you!
Let's personalize your content
Let's get even more personalized
We recognize your account from another site in our network, please click 'Send Email' below to continue with verifying your account and setting a password.


Let's personalize your content