This site uses cookies to improve your experience. To help us insure we adhere to various privacy regulations, please select your country/region of residence. If you do not select a country, we will assume you are from the United States. Select your Cookie Settings or view our Privacy Policy and Terms of Use.
Cookie Settings
Cookies and similar technologies are used on this website for proper function of the website, for tracking performance analytics and for marketing purposes. We and some of our third-party providers may use cookie data for various purposes. Please review the cookie settings below and choose your preference.
Used for the proper function of the website
Used for monitoring website traffic and interactions
Cookie Settings
Cookies and similar technologies are used on this website for proper function of the website, for tracking performance analytics and for marketing purposes. We and some of our third-party providers may use cookie data for various purposes. Please review the cookie settings below and choose your preference.
Strictly Necessary: Used for the proper function of the website
Performance/Analytics: Used for monitoring website traffic and interactions
Because they can preserve the visual layout of documents and are compatible with a wide range of devices and operating systems, PDFs are used for everything from business forms and educational material to creative designs.
In today's digital age, the rise of the internet has given us two powerful mediums for expressing creativity: web design & graphic design. Web design involves creating websites, interfaces, & online applications while graphic design entails creating visual designs for print & digital media.
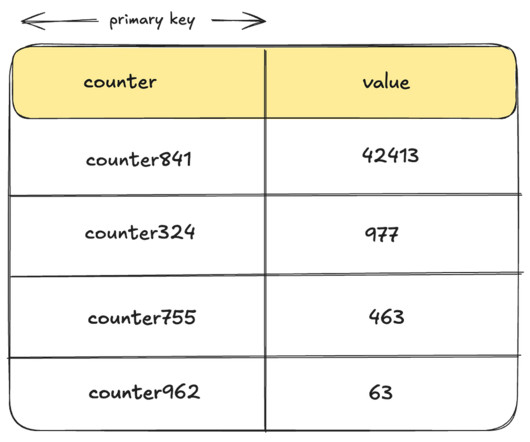
By: Rajiv Shringi , Oleksii Tkachuk , Kartik Sathyanarayanan Introduction In our previous blog post, we introduced Netflix’s TimeSeries Abstraction , a distributed service designed to store and query large volumes of temporal event data with low millisecond latencies. Today, we’re excited to present the Distributed Counter Abstraction.
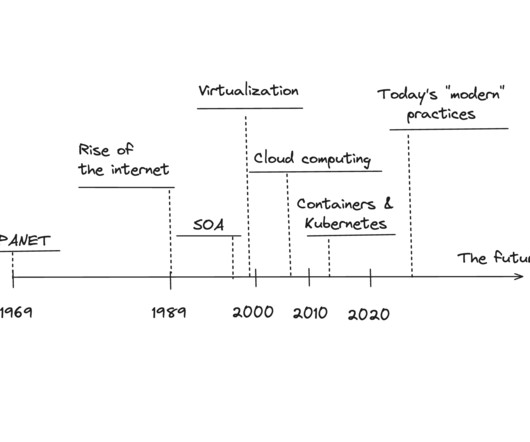
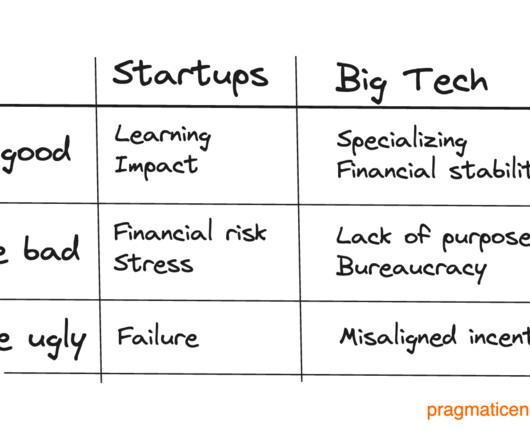
Joshua also writes an excellent Substack newsletter about how to design products which customers love, how to operate live services at scale, grow and optimize your technology orgs, and the history of the tech industry. ARPANET was designed to maintain communications during outages. Subscribe here.
Why do some embedded analytics projects succeed while others fail? We surveyed 500+ application teams embedding analytics to find out which analytics features actually move the needle. Read the 6th annual State of Embedded Analytics Report to discover new best practices. Brought to you by Logi Analytics.
Since snowboards often have a wooden core, and because a snowboard is the traditional trophy for the Snowflake Startup Challenge, were going to go ahead and say that the snowboard trophy qualifies as a present for the fifth anniversary of our Startup Challenge. The judges will deliberate live before naming the 2025 Grand Prize winner.
We also co-presented talks at EkoParty, DEF CON, Hardwear.io, Pwn2own, and other security research summits. We received more than 100 bug reports and awarded over $320,000 in total.
In simple terms, “inventory” refers to the list of items present in a specific store of a Convenience and Grocery (CnG) merchant. The post How DoorDash Designed a Successful Write-Heavy Scalable and Reliable Inventory Platform appeared first on DoorDash Engineering Blog. Before we dive in, let’s define some important terminology.
This situation presents both challenges and opportunities; while it may be more difficult to make initial progress, there are plenty of easy wins to capitalize on. These elements are critical for a titles eligibility in a row, accurate personalization, and an engaging presentation. artwork, trailers, supplemental messages).
Embedding analytics in software presents some unique opportunities—and poses unique challenges—to software teams. What are best practices when designing the UI and UX of embedded dashboards, reports, and analytics? What should software teams know about implementing security that works with the rest of their products?
To address these challenges, AI Data Engineers have emerged as key players, designing scalable data workflows that fuel the next generation of AI systems. Complexity and Variability Each type of unstructured data—text, images, videos, or audio—presents unique challenges. Their role is not just important; it is essential.
In this blog, we will go through the technical design and share some offline and online results for our LLM-based search relevance pipeline. Technical Design LLM as Relevance Model Model Architecture We use a cross-encoder language model to predict a Pins relevance to a query, along with Pin text, as shown in Figure 1.
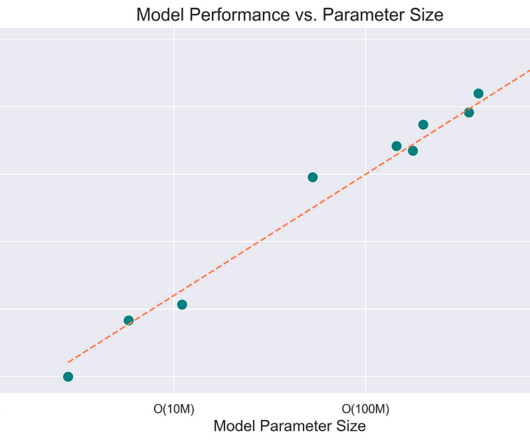
According to Tomasz, an AI use-case presents the opportunity for cost reduction if one of three criteria are met: 1. Like Google, large models are designed to service a variety of use-cases. While those numbers are certainly impressive by modern standards, they still present some key limitations for the use of AI.
Here we explore initial system designs we considered, an overview of the current architecture, and some important principles Meta takes into account in making data accessible and easy to understand. Obtaining this data from Hive in a format that can be presented to users is not straightforward. What are data logs?
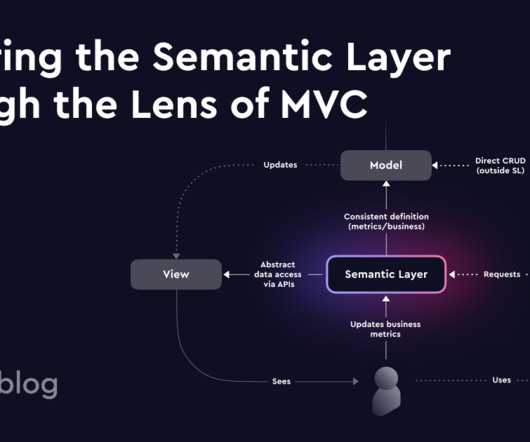
MVC is an interesting concept from the late 70s that separates the View (presentation) from the Controller via the Model. It has been used in designing web applications and is still heavily used, for example, in Ruby on Rails or Laravel, a popular PHP framework.
Key Takeaways: Data mesh is a decentralized approach to data management, designed to shift creation and ownership of data products to domain-specific teams. This complexity requires a mature data engineering team to design, implement, and manage it effectively.
This article is the first in a multi-part series sharing a breadth of Analytics Engineering work at Netflix, recently presented as part of our annual internal Analytics Engineering conference. It is challenging to scale such bespoke solutions to ever-changing and increasingly complex businessneeds.
Those without the capacity relied on an existing unified data source, such as our Presentation API, inheriting its version of product data. To serve the presentation view of a Product Offer, a multi-stage event-driven system merged Product, Price, and Stock events into a single structure. This led to competing sources of truth.
Yet, the complexity and computational demands of LLM inference present a challenge. It is designed to facilitate research and prototype new ideas for post-training without getting overwhelmed by complex abstraction layers or generalizations. Inference costs remain prohibitive for many workloads.
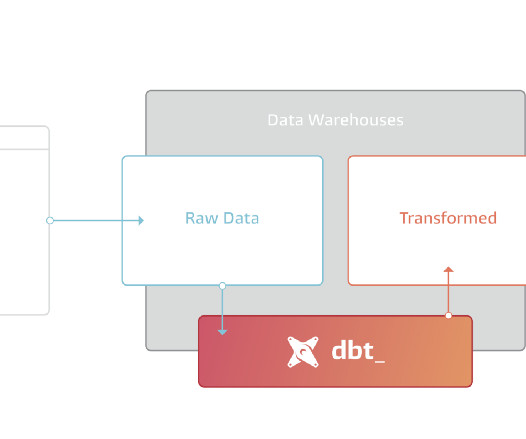
This is a methodology that has been designed more than 20 years ago that optimise the storage used. In these articles there are a lot of cool presentations you should watch to understand deeper how dbt works. You can choose the strategy you want depending on your adapter (cf. examples on BigQuery ).
This article is the second in a multi-part series sharing a breadth of Analytics Engineering work at Netflix, recently presented as part of our annual internal Analytics Engineering conference. To better guide the design and budgeting of future campaigns, we are developing an Incremental Return on Investment model. Need to catch up?
This grant is designed to “support entrepreneurs, tech-geeks, developers, and socially engaged people, who are capable of challenging the way we search and discover information and resources on the internet” The team is tiny; only three people.
Message bus is a common architectural design in the Enterprise Design Patterns. But it's also present at a lower level to enable the event-driven behavior. Apache Spark is not an exception. It uses a publish/subscribe approach in various places.
The presenters Shrikrishna Khare and Srikrishna Gopu, talk about their experience designing, developing, and operating FBOSS: An in-house software built to manage and support a set of features required for data center switches of a large-scale Internet content provider.
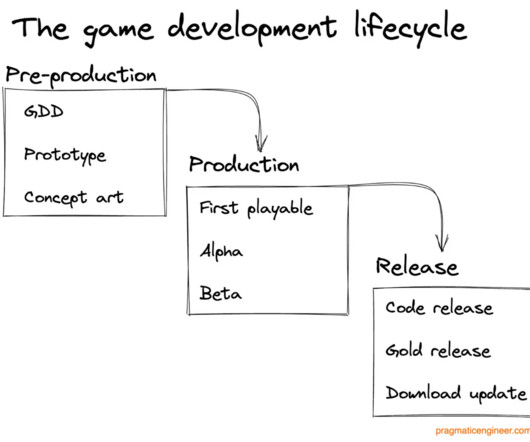
Games Are Software, But in a Non-Standard Way Video games can often feel far removed from traditional software, given the modes of interaction and style of presentation are often unique to this space. I often explain this working relationship as that artists make it pretty , while designers and programmers make it work.
For data engineers who battle to build and scale high quality data workflows on the data lake, Starburst is an end-to-end data lakehouse platform built on Trino, the query engine Apache Iceberg was designed for, with complete support for all table formats including Apache Iceberg, Hive, and Delta Lake. Want to see Starburst in action?
Simplifying to Amplify This renaming is part of a broader effort to simplify how we present our offerings. Best of all, they are all designed to work together seamlessly, providing you with the capabilities for a smooth path from raw data to AI-driven results. Within it, youll find capabilities that clearly map to what they deliver.
Below are experienced speakers who have presented at conferences and have confirmed they are open to such opportunities (including traveling to locations in the Netherlands.) See his talk at React Live 2023 (a case study of a successful migration) and at JSWORLD 2022 (designing high-performance React applications.) See more past talks.
As I often do I've overlooked the 70 presentations and here a medley of what I've liked. The presentation gives another look at the semantic layer. During the demo, Llyod does some data analysis in the browser and it's just mind-blowing 🤯 At the same time someone Google also did a Calcite presentation.
Fig 1 illustrates a general multi-stage recommendation funnel design in Pinterest. General multi-stage recommendation system design in Pinterest. This section illustrates the current machine learning design of the two-tower machine learning model for learned retrieval at Pinterest.
There were many Gartner keynotes and analyst-led sessions that had titles like: Scale Data and Analytics on Your AI Journeys” What Everyone in D&A Needs to Know About (Generative) AI: The Foundations AI Governance: Design an Effective AI Governance Operating Model The advice offered during the event was relevant, valuable, and actionable.
The dbt MCP server presents our early explorations, but we anticipate that the Community will find many more. Determining the most useful tools for the dbt MCP What are the best and most useful set of tools to enable human in the loop and AI driven LLM access to structured data?
Below are experienced speakers who have presented at conferences and have confirmed they are open to such opportunities (including traveling to locations in the Netherlands.) See his talk at React Live 2023 (a case study of a successful migration) and at JSWORLD 2022 (designing high-performance React applications.) See more past talks.
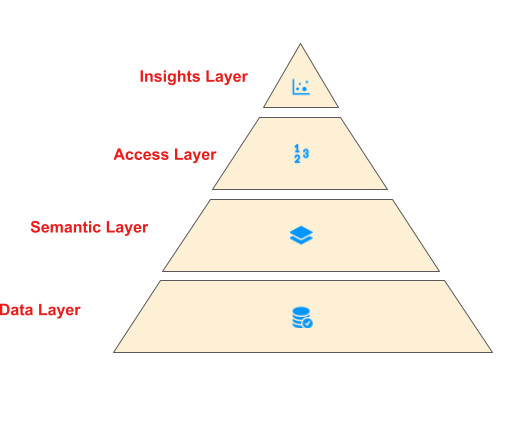
Read Time: 2 Minute, 11 Second In today’s data-driven world, organizations demand powerful tools to transform, analyze, and present their data seamlessly. GOLDEN Layer : Curated tables (dimensions and facts) designed for analytics and reporting. SILVER Layer : Cleansed and enriched data prepared for analytical processing.
This focus on training pipeline steps which take in heterogeneous inputs with multiple objective functions, and emits co-trained models which are already part of an implicit inference graph centers the application development experience in the place where the AI engineer feels most at home: designing the recommender model itself.
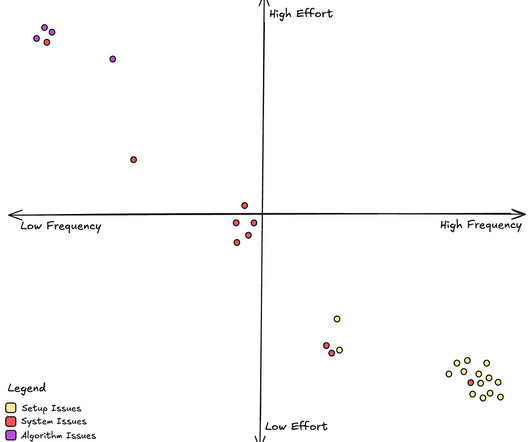
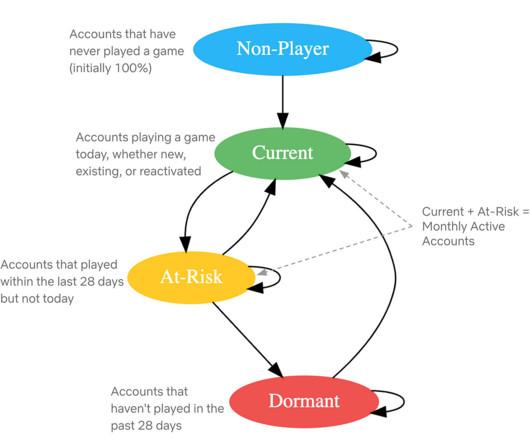
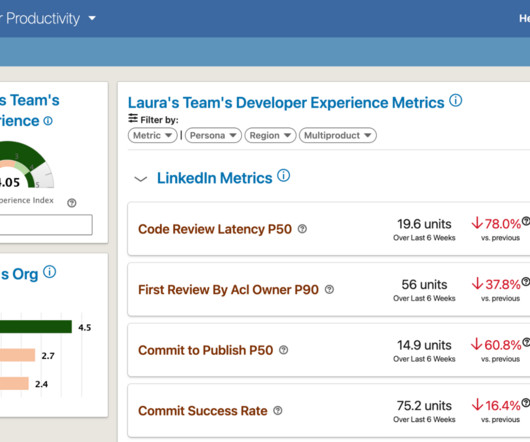
This blog post will provide an overview of how we approached metrics selection and design, system architecture and key product features. Metrics Design and Selection We started with a simple question: What should we measure? To answer that we followed a metrics design framework called “Goals-Signals-Metrics.” (GSM)
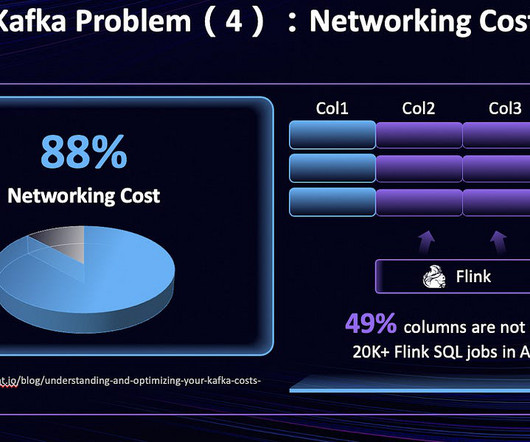
Fluss is a streaming storage specifically designed for real-time analytics. Fluss and Kafka differ fundamentally in design principles. Kafka is designed for streaming events, but Fluss is designed for streaming analytics. Fluss is designed for real-time analytics. What is Fluss and its use cases?
In terms of the conference, what are the factors that you consider when deciding how to group the different presentations into tracks or themes? What are the most interesting, unexpected, or challenging lessons that you have learned while working on selecting presentations for this year's event?
I was still recovering from this failure in 2015, when a friend who designed the first version of Uber– Jelle Prins – pinged me, and said Uber was kickstarting an engineering office in Amsterdam. This last one was a great adventure; we went to the US to join the TechStars 2013 accelerator.
The blog narrates how Apache Arrow offers better data serialization efficiency and avoids design pitfalls from the past. The blog stresses the need for granular, structured feedback, especially from experts, and outlines key considerations for evaluation design. What we learned?
How can we design systems that recognize these nuances and empower every title to shine and bring joy to ourmembers? They allow us to verify whether titles are presented as intended and investigate any discrepancies. Yet, these pages couldnt be more different. How do we bridge this gap?
These insights have shaped the design of our foundation model, enabling a transition from maintaining numerous small, specialized models to building a scalable, efficient system. Addressing unique challenges, like cold start and presentation bias, the model also acknowledges the distinct differences between language tasks and recommendation.
With the broader audience comes the need to present data in a more approachable format. With the broader audience comes the need to present data in a more approachable format. Summary The primary application of data has moved beyond analytics. Can you describe what is encompassed by the idea of a data product strategy?
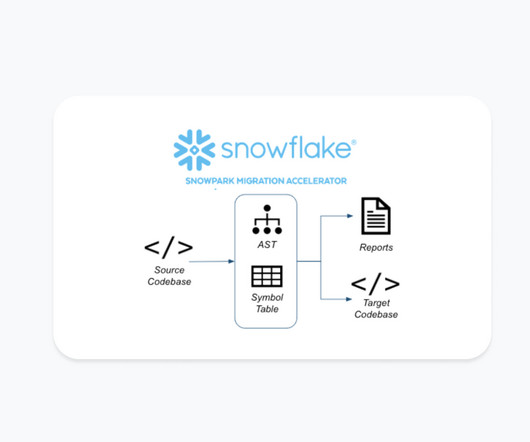
Designed for processing large data sets, Spark has been a popular solution, yet it is one that can be challenging to manage, especially for users who are new to big data processing or distributed systems. The Snowpark Migration Accelerator builds an internal model representing the functionality present in the codebase.
We organize all of the trending information in your field so you don't have to. Join 37,000+ users and stay up to date on the latest articles your peers are reading.
You know about us, now we want to get to know you!
Let's personalize your content
Let's get even more personalized
We recognize your account from another site in our network, please click 'Send Email' below to continue with verifying your account and setting a password.


Let's personalize your content